Markets in a Bullish Landscape, but Beware of Speed Bumps

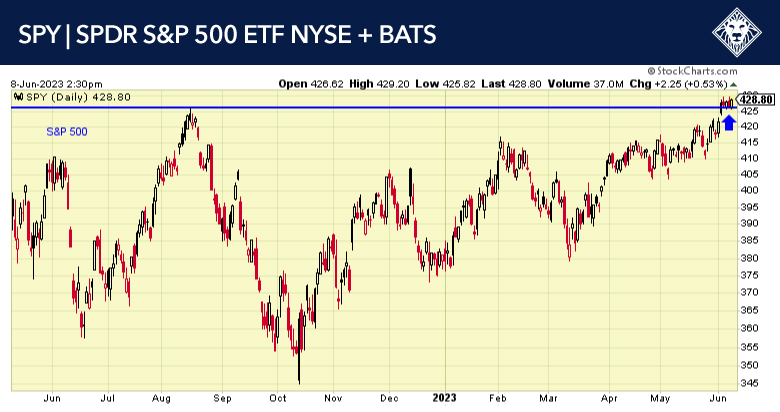
23-7-31-SPY

Chart: SPY 1-year daily

Last week we witnessed the market sell off hard on Thursday and rally back even stronger on the PCE news, which was very encouraging. The markets are clearly in an uptrend and look strong, but with that said, they are looking a bit frothy. A pullback is warranted and probably near-term, but it should be shallow and short-lived. There is a tremendous amount of cash on the sidelines, and investors are way underinvested, which should create a nice base to work higher from.
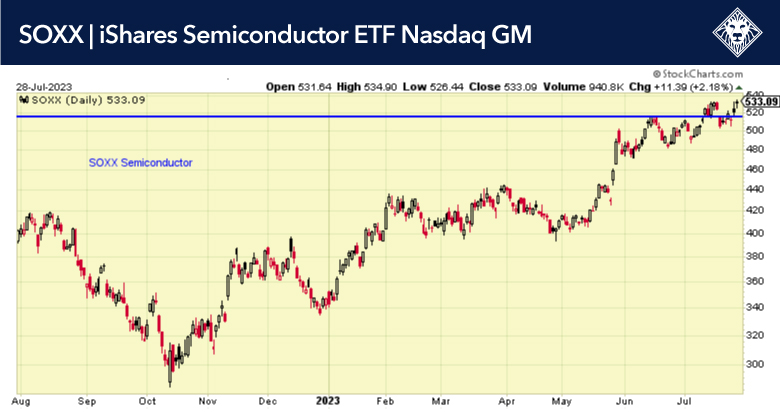
23-7-31-SOXX

Chart: SOXX 1-year daily

The semiconductor index is still strong, with chips and AI being the leading areas of the rally. This indicates that the market is broadening out, which is one of the key ingredients in confirming a new bull market, which we believe we entered in late January.

Inflation pressures continued to moderate in June, confirming the Fed’s shift to a slower pace of tightening this year. Most of the slowdown in inflation, including in the latest month, has come from the goods side. But core inflation continues to run above the Fed’s target of 2.0%, as underlying price pressures, including from the super-core, remain elevated. As favorable base effects wane in the second half of this year, further progress on inflation will prove more difficult, especially if the labor market remains tight and consumer demand holds up. This suggests that while the Fed may be nearing the end of its tightening cycle, it may keep rates higher for longer than markets currently anticipate.

The PCE Price Index and its core both picked up 0.2% in June from the prior month, matching the consensus estimate. For the core, this was the smallest gain in nearly a year, led almost exclusively by lower goods prices. Indeed, core goods prices fell 0.1%, down for the first time this year, while core services prices rose a near-steady 0.3%. Within services, both housing and super-core prices (i.e., services ex-energy and housing) posted similar gains to the prior month.

The Employment Cost Index (ECI) rose 1.0% in Q2, the smallest gain in two years, and below the consensus estimate of 1.1%. Both private sector and government employee compensation eased slightly from the prior quarter. Within the private sector, there was a notable deceleration in goods-producing industries compensation costs, with wages and salaries rising only 0.6%. This was a significant drop-off from the 1.5% gain in the previous quarter, and it was the smallest gain since Q3 2020. Service sector wages and salaries, however, rose a steady 1.1%, the same for three consecutive quarters, and higher than the 0.7% average in the three years prior to the pandemic.


Bulls Licking Their Lips After Today’s CPI Number

23-7-12-SPY

Today’s CPI number was very encouraging for the bulls, as inflation is clearly dropping. I was on CNBC Asia last night (a short clip is included), and they pressed me on why I think we are in a new bull market.

23-7-12 Vance Howard on CNBC

The HCM-BuyLine® is positive, inflation is dropping, a record amount of cash is on the sidelines, low unemployment, a strong economy, and the list goes on from there. Could this be setting up to be a Goldilocks market?

Today’s June CPI was very good, showing a downside break in core inflation (core CPI) and hints of a sustainable decline in inflationary pressures for the next few months. Core CPI came in at +0.16%, a solid downside surprise compared to +0.30% consensus. No “sticky inflation”: as inflation has broken to the downside and the Fed doesn’t have to break the economy!

As of now, 45% of CPI is in outright deflation, vs 30% 50-yr avg and inflation is set to fall like a rock. Why would the Fed keep Fed funds at 5.5% if core inflation is tracking towards 3.0% or lower by December 2024? This is why investors might need to think about Fed cuts in 2024.

The HCM-BuyLine® is positive and all pullbacks should be considered buyable.


Russian Unrest Has Little Effect – S&P 500 Set For Takeoff?

23-6-26-SPY

Chart: SPY 1-year daily

The markets pulled back last week, which was not unexpected because a period of consolidation was needed for the market to work its way higher. Again, as long as the HCM-BuyLine® is positive, all pullbacks should be considered buyable. The unrest in Russia has had very little impact on the markets, which is interesting, and we see no reason for the market to get too excited about the weekend events in Russia.

If the market closes up this week, that would put the S&P 500 up over 10% YTD. If history repeats itself, which we think it most likely will, any time the S&P 500 has been up over 10% at the midway point of the year, it has moved about 12% higher by year-end.

U.S. economic growth softened in June, but remained positive, according to the flash PMIs. The S&P Global Flash U.S. Composite PMI fell 1.3 points to 53.0. Although this reading marked a three-month low, the PMI held in expansion territory for a fifth straight month, confirming our view that the U.S. is not in recession currently.

Growth was entirely driven by the services sector, which saw its PMI ease 0.8 points to 54.1. It was still the second-highest reading since April 2022 and well above the consensus for a much larger decline to 53.3. New orders remained strong, boosted by export orders, while the future output index rose to the highest in over a year. Employment grew at a slower pace, due to worker shortages, which contributed to a build-up in backlogs. Input costs accelerated to a five month high, led by higher labor costs, but charge prices rose at a slower pace as businesses wanted to remain competitive.

Manufacturing shrank at a faster pace, as the PMI slumped 2.1 points to 46.3, a six-month low and notably below the consensus of 49.0. Output declined for the first time in four months, while new orders contracted at the fastest pace since December, due to weak demand and sufficient inventories. Future output expectations remained positive, but by the least this year. Input costs shrank at the fastest pace since May 2020, while output prices were essentially flat.


Market Heats Up As Hiring Cools – Is A Broadening Market Signaling New Opportunity?

23-6-8-SPY

Chart: SPY 1-year daily

The market is in a clear uptrend, and any pullback is buyable now. Yesterday’s pullback was technical and warranted, as the market is a bit overbought. Today’s jobs report was telling, as hiring is slowing down. As we have been saying, it is our opinion that the Fed has pushed rates as high as they need to be to slow things down. At this point, being patient is prudent; it takes time for the rate increase to start having the effect the Fed would like. We feel the Fed will pause the rate increase, but the statements after the meeting could be telling: will they be hawkish or dovish?

The market has mostly been concentrated in FAANG and tech stocks, but late last week and early this week things have started to broaden out. This is a good sign that the market is at least trying to establish another bull market, if it hasn’t already done so.

Initial claims for unemployment insurance jumped 28,000 last week to 261,000, the highest level since October 2021, and well above the consensus of 236,000. It was the third consecutive weekly gain and the most since July 2021. While most of it could be penciled to seasonal adjustments (the unadjusted increase was a much smaller 10,535 to 219,391), it is nonetheless significant, as it moved the level of claims above the range of 220,000-250,000 where they have been since February. The four-week average of claims picked up by 7,500 to 237,250. The data is subject to revisions and could tell a different story in subsequent weeks, but where it stands now it suggests some pickup in layoffs and softening in labor demand.


Revving Up For The Bull – Markets Showing Signs Of Optimism

23-6-1-SPY

Chart: SPY 1-year daily

Are we in a new bull market? Most, if not all, indicators are pointing in that direction. The HCM-BuyLine® is clearly positive, and pullbacks are buyable. As I wrote about last week, it is the tale of two markets: if you are not heavily invested in tech and FAANG stocks, you have basically made no money.

23-6-1-QQQ

Chart: QQQ 1-year daily

We did break out of the two areas of resistance on QQQ, and the S&P 500 is trying to stage a breakout as well. The banking sector has held the S&P back, but banks, if the Fed doesn’t botch it for all of us, are oversold and a buyable sector.

To assess where we are with other areas and understand why this is a tale of two markets, let’s look at the Dow Jones Industrial Average, which is up a modest 3.30%. DVY, the ETF that serves as a good proxy for dividend and value stocks, is down a whopping -9%. IWM, the ETF of the Russell 2000, which is a broad index, is basically flat at 0.03% YTD, and MDY, an ETF of mid-caps, is also down -0.03% YTD.

AI has made a significant impact on the positive returns in tech and the FAANG stocks, and we expect this trend to continue. In the past week, there has been a notable, incrementally positive shift in investor sentiment towards equities. Previously, many pundits claimed that stocks were ignoring enormous risks such as the debt ceiling (which is about to be off the table), war, inflation, and the Fed’s resolve, and that fundamentals could never justify the “unsustainable valuation expansion.” However, it seems that bears are now swayed by strong 1Q23 earnings (+700bp beat). Companies are making money, and the chance of a recession has dropped dramatically.


Markets Trending Up With FAANG Stocks Leading The Charge

23-5-22-SPX

Chart: SPX 1-year daily

The S&P 500 is trying hard to break above the 4220 level and should do so in the next week or so. The market is overbought, and a modest pullback is warranted. All pullbacks at this point are buyable as the trend is firmly up. Once we get the break above 4220, the next level of resistance is in the 4325 range.

23-5-22-DVY

Chart: DVY 1-year daily

This is the tale of two markets: the FAANG stocks, along with technology, have been leading this rally in a big way. The value/high dividend payers are down for the year. A good ETF that follows value and dividends is DVY, and you can see from the chart that the first 5 months of the year have not been kind. The Russell 2000, which is a broader index, is only up 0.70 less than a point, and the DJIA is flat for the year. The broader market should start to broaden out as the market continues to move higher.

The debt ceiling is on investors’ minds as negotiations continue. It looks like a lot of theater, and we suspect both sides will reach some form of compromise in the next week or so. Biden and McCarthy are set to meet today as pressure to find an exit strategy for the debt ceiling crisis grows. A discharge petition in the House and Biden invoking the 14th Amendment are unlikely tools for solving the debt ceiling deadlock.

14 companies are reporting earnings this week. Of the 469 companies that have reported so far (94% of the S&P 500):

  • Overall, 77% are beating estimates, and those that beat are beating by a median of 8%.
  • Of the 22% missing, those are missing by a median of -6%.
  • On the top line, overall results are beating estimates by a median of 5% and missing by a median of -3%, and 76% of those reporting are beating estimates.

Positive Earnings Offer Breakout Hopes During Spring Doldrums

23-5-15-SPY

Chart: SPY 1-year daily

The S&P 500 continues to bounce off a point of resistance in the $417 area, as it has been trading in a sideways range since April. We expect it to break above that area in the near term and move up to the $433 area, where we could encounter some more resistance. We believe the Fed is finished with rate hikes, and the rate increases are having the desired effect.

The market was somewhat encouraged by the April Atlanta Fed wage tracker (5/12) which showed wage growth fell to +5.1%, this was the lowest figure since 2021. This appears to confirm what we are seeing, which is that the uncertainty in banks such as SVB and the other troubled regionals is doing the Fed’s job for them in slowing things down.

Earnings are coming in pretty good; companies are making money even with pressure from interest rate hikes. Of the 457 companies that have reported so far (91% of the S&P 500), overall earnings results are beating estimates by a median of 8%, and 77% of those reporting are beating estimates.

On the top line, overall results are beating estimates by a median of 5%, and 75% of those reporting are beating estimates.


Is The Fed Done Raising Rates Or Just Taking A Coffee Break?

23-5-8-QQQ

Chart: QQQ 1-year daily

The Fed raised the rate by 25 bps last week, and in our opinion they are most likely done. If they had not raised rates, there would have been a big question as to how bad the bank issue is/was. As we said before, we think the Fed is done raising rates. Banks have pulled back from lending which will slow things down, and we believe the possibility of a soft landing, or no recession is looking promising.  

The markets are in a clear uptrend, and pullbacks are buyable. The markets are still very shaky, as investors are on edge after 2022, and this is understandable. The QQQs, which is an ETF that tracks the NASDAQ 100, has just peaked its head above the $322 mark. This is a pivot point, and any real break above that level would indicate a new breakout to the upside with a target of $380, which would be a very strong move.

Money market shares show that assets were again higher among the largest U.S. money market fund complex in April. Money market fund assets jumped $56 billion, or 1.1%, last month to a record $5.685 trillion, and yes, that’s correct – trillion. Total MMF assets increased by $707.2 billion, or 14.0%, over the last 12 months. What does the massive amount of cash on the sidelines mean? It is the fuel for the next bull market, and it could go on for a long time.

23-5-8-KRE

Chart: KRE 1-year daily

Regional banks are trading like they are all going out of business, which is not the case. Look for a trader’s rally, possibly as high as 10-15% off the bottom.


AGG Shows Signs of Life – Time for the Bond Market Boogie?

23-5-1-QQQ

Chart: QQQ 1-year daily

The market is trading just about as anticipated, with a pullback in the last week or so, and a nice rally pushing us up into the important range of $322 on QQQ. If we can get a powerful breakthrough in this area of resistance, that would be very bullish for the markets going forward. Also, look at AGG, the aggregate bond index, which is trading much better for the overall bond market. It is trading above the 200-day moving average and trying to break out of a pivot point, which could be very bullish for the bond market overall. Could the bond market be signaling to us that the Fed is almost done raising rates?
23-5-1-AGG
Although both headline and core PCE inflation pressures eased in March, progress was uneven and likely not enough for the Fed to call it quits on tightening. We expect another rate hike this week. Even if the tightening cycle ends soon, so that lagged policy effects can play out, we expect the Fed to keep rates higher for a period. The PCE Price Index edged up 0.1%, the least in eight months, led by lower food and energy prices. Core PCE prices increased 0.3%, the smallest gain in four months, and matching the consensus. Core goods prices, which were falling late last year, rose 0.2% in March, its third consecutive gain, and more than in the prior month. Core services prices, however, rose 0.3%, the least in eight months, as housing price gains moderated. On a y/y basis, PCE inflation fell to 4.2% from 5.1% in the previous month, the slowest rate since May 2021. Core PCE inflation showed less progress, ticking down to 4.6% from 4.7%, above the consensus of 4.5%. Services ex-energy and housing inflation, or the super-core, edged down to 4.4% from 4.7%, but remained within its 3.9%-5.1% range over the past two years. Since the super-core tends to be sticky, it suggests that the broader core PCE inflation will have a hard time reaching the Fed’s 2.0% target.

Privacy Settings
We use cookies to enhance your experience while using our website. If you are using our Services via a browser you can restrict, block or remove cookies through your web browser settings. We also use content and scripts from third parties that may use tracking technologies. You can selectively provide your consent below to allow such third party embeds. For complete information about the cookies we use, data we collect and how we process them, please check our Privacy Policy
Youtube
Consent to display content from - Youtube
Vimeo
Consent to display content from - Vimeo
Google Maps
Consent to display content from - Google