Vix Calm in the Face of Recent Selling

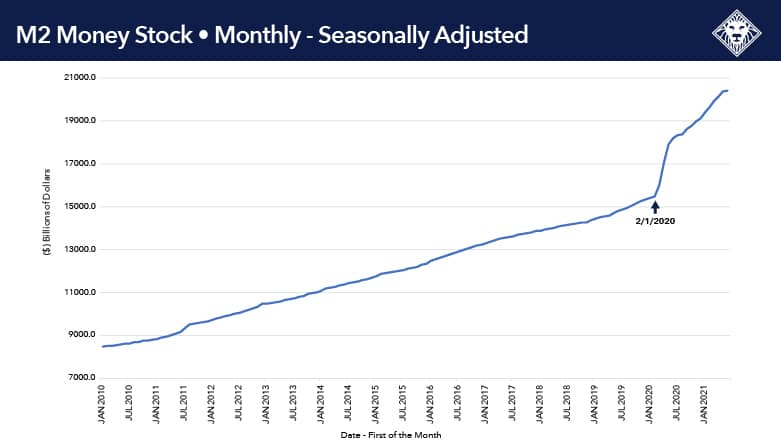
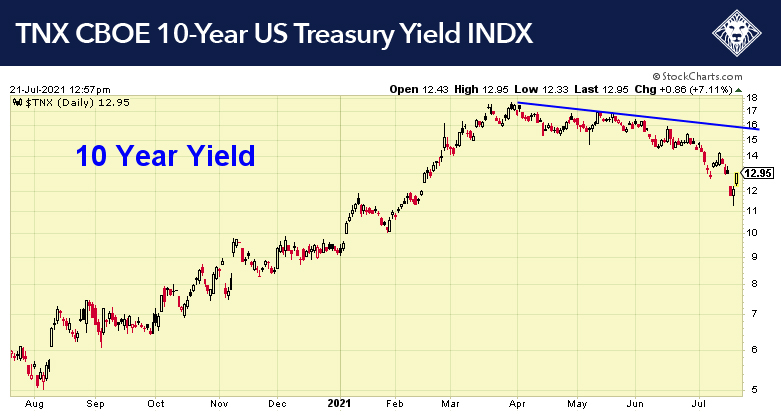
The HCM-BuyLine® is positive, and any pullback should be bought. Covid has put some pressure on the market, along with the markets being a bit overbought. The VIX index, which is a measure of volatility, has been very tame even with some of the selling we have seen the last few days which leads us to believe a rally is building up steam and is imminent. Interest rates have ben organically moving up which is putting pressure on bond prices. Bond investors will probably start to look for alternatives such as high-dividend paying stocks as bond prices continue to slide.

The Empire Manufacturing General Business Conditions Index dropped 24.7 points in August to 18.3, well below the consensus of 29.0. It was the third decline in the past four months and the most since the lockdown in April 2020, as factory activity growth in the region moderated significantly.

New order growth eased, while shipments nearly stalled. Both payrolls and hours worked grew at slower rates. Firms continued to face supply side challenges, as deliveries slowed and backlogs accumulated at a quicker pace versus the previous month. Input price pressures eased modestly, while selling prices rose at a new record rate, a sign of sellers’ pricing power and strong ability to pass higher costs onto clients.

The Expectations Index rebounded 7.0 points to 46.5, its second-highest level in 14 months, as manufacturers remained optimistic about the near-term growth outlook. They expect a rebound in shipments and new orders and normalization in supplier deliveries and backlogs. Nevertheless, the outlook for price pressures remained elevated.


Jets ETF Could Be Ready For Takeoff With Some Cash Finding Its Way Back Into the Market

The markets are trading as expected; a bit overbought but nothing too concerning. JETS, the ETF of global airline stocks, is still very oversold, and we see any good news on the Covid Delta variant as a catalyst to springboard this sector up quickly. It could also be worth looking at the gaming stocks which are oversold as well. Interest rates look to be rising and bond prices are falling, and the rise in bond yields should have a very positive effect on the financial and banking sectors. 

JETS

There are several standard measures of the money supply, including the monetary base, M1, and M2.

Steve Meyer, one of our lead analysts, wrote this about the money supply:

•The monetary base is the sum of currency in circulation and reserve balances (deposits held by banks and other depository institutions in their accounts at the Federal Reserve).

•M1 is the sum of currency held by the public and transaction deposits at depository institutions (which are financial institutions that obtain their funds mainly through deposits from the public, such as commercial banks, savings and loan associations, savings banks, and credit unions).

•M2 is M1 plus savings deposits, small-denomination time deposits (those issued in amounts of less than $100,000), and retail money market mutual fund shares. 

Over some periods, measures of the money supply have exhibited fairly close relationships with important economic variables such as nominal gross domestic product (GDP) and the price level. Based partly on these relationships, some economists—Milton Friedman being the most famous example—have argued that the money supply provides important information about the near-term course for the economy and determines the level of prices and inflation in the long run. Central banks, including the Federal Reserve, have at times used measures of the money supply as an important guide in the conduct of monetary policy.**

Over the past few decades these relationships have been quite unstable. Nevertheless, the Federal Reserve still regularly reviews money supply data as part of a wide array of financial and economic data that policymakers review.

We have experienced an approximate 32% increase in M2 money supply compared to pre-COVID levels, leaving consumer and corporate pockets full of cash. This huge increase in money supply will drive inflation in the long term. That being said, the current U.S. monetary policy coupled with the already substantial increase in M2 money supply can easily continue to push the market to new highs.

The month over month growth in June 2021 (.09%) is the smallest monthly increase since October 2018 (.05%) compared to a 6.42% monthly increase seen in April of 2020. Are we seeing the increase in money supply begin to lose traction? Is this a decrease in inflationary pressure? Are we seeing money that has been on the sideline find its way back into the market? We can’t claim to have a crystal ball. However, like the federal reserve, we will continue to monitor this cash build up.

**federalreserve.gov


Semiconductors Scorching as Suppliers Work to Meet Demand.

The Semiconductor sector is doing about what we predicted and has now had a solid breakout. The last 2 quarters for the year should be good for this sector as chip manufacturers work hard to catch up with demand. Expect more of a choppy market for August, as July and August are historically very choppy and usually do not provide for a lot of gains. Covid is having some effect on the markets, but it is our opinion that it is likely just because it is this time of year, and the markets are overbought. 

The ISM Services PMI shot up 4.0 points in July to 64.1, a record high, and above the consensus of 60.8. It shows a significant surge in services activity at the start of Q3, in contrast to a softer pace of growth in the manufacturing sector. The combined latest readings of the ISM Services and Manufacturing PMIs correspond to 4.4% real GDP growth annually. It suggests that while the expansion has lost some momentum in early Q3, growth is quite robust and there is no risk of recession on the near-term horizon.

Most individual activity indexes posted strong gains last month. Business activity rebounded 6.6 points to 67.0, the third highest reading ever. New orders and employment growth also picked up. Similar to manufacturing, services continued to be plagued by shortages and bottlenecks. The supplier deliveries index climbed 3.5 points to 72.0, second only to the reading from April 2020 when the economy was in the midst of a pandemic lockdown. Because of these nearly unprecedented vendor delays, firms dipped again into their inventories, which fell further into contraction territory. Inventory sentiment fell to another record low, which is as much a sign of strong future demand as it is a sign of firms’ trepidations about meeting that demand. Order backlogs accumulated at a near-record pace, highlighting mounting capacity constraints, despite the uptick in the hiring pace. Import order growth eased, while export order growth rebounded to the fastest rate since May 2007.

ADP private payrolls increased 330,000 in July, the smallest gain in five months, and well below the consensus of 628,000. The three-month average dipped to its lowest level since April, as job creation has lost momentum over the past several months. Since ADP payrolls are still 6.5 million short of their pre-recession peak, the current pace of job growth implies that the peak will not be recovered until June 2022. This is in contrast to real GDP, which surpassed its pre-recession high in Q2. ADP noted that “bottlenecks in hiring continue to hold back stronger gains.” While some of the factors weighing on labor participation, such as childcare options and unemployment benefits, should ease in the coming months, the recent spike in COVID cases presents a near-term headwind. 


Computer Chips Could Provides Opportunity During Summer Doldrums

The markets are trading pretty much as we anticipated. The HCM-BuyLine® is positive and is still very strong, so any pullback should be bought. July and August are historically slow months and usually produce nothing but volatility; this seems to be holding true in 2021. We do expect the market to be higher by year-end. 

Like we stated in the past few Wealth Watch updates, AMZN has broken out of a 9-month base, and we expect that equity to move higher in the near-term. We are also bullish on SOXX, which is the ETF that tracks the semiconductor index. Chips have been in short supply and have held back some industries such as auto from being able to manufacture as fast as they would like. This is starting to ease up a bit, and we expect that by year-end it will not be nearly the problem it is now. 

To add to our outlook on chips, Qualcomm (QCOM), the world’s largest smartphone chipmaker, delivered a bullish quarterly forecast helped by the growth of 5G networks and consumer demand for new devices. On Wednesday, the company said earnings will be $2.15 to $2.35 per share for the period ending in September, which is well ahead of the average projection of $2.07. Revenue will be $8.4 billion to $9.2 billion, compared with an estimate of $8.5 billion.

Private sector gross job gains fell by 2.0 million in Q4 2020 to 8.8 million, which was still the second highest level since Q1 2000. Gross job losses slipped by 188,000 to 6.7 million. As a result, there were 2.0 million net job gains at the end of last year, the second most since data started in 1992. It shows that employment dynamics continued to normalize, following the pandemic shutdown and massive job loss in the first half of last year.

All 13 industries posted net job gains, but most were in services. Nearly 2/3 of all net job gains were in professional and business services, transportation and warehousing, and education and health care. 


Shaky Markets in July Not Necessarily a Cause for Concern

Bond yields were falling on Monday’s equity selloff, with the selloff helping to push a flight to the relative safety of bonds. The 10-Year Treasury yield fell below its 200-day moving average to the lowest level since February, and that is hurting financial stocks. The Financial Sector SPDR (XLF) is threatening its June low. Furthermore, the Energy SPDR (XLE) fell to a 3-month low after a big drop in the price of oil, making energy shares the day’s weakest sector. 

Sufficient panic shown in VIX term structure is associated with market bottoms. July is historically very choppy, and despite the HCM-BuyLine® being positive, being patient for a few days or a week or two during this time of chop could be wise. 

The global story of COVID-19 is the Delta variant. Over the past 8 weeks, the story of COVID-19 has become almost singularly about the Delta variant.  We feel this is more media driven news than a real cause of great concern.

Retail sales rebounded 0.6% in June, contrary to the consensus of -0.4%. It was the third increase in the past four months and followed a downwardly revised -1.7% in May. The surprise increase last month was due in large part to higher consumer prices, as retail sales are reported in nominal terms. Discounting by the CPI for consumer commodities, which was up 1.7% in June, suggests that real retail sales actually declined by about 1.0% for the month.

Nevertheless, the surprise increase in retail sales suggests that companies’ revenues are growing. Most major categories posted solid gains, led by miscellaneous stores (+3.4%) and electronics and appliance sales (+3.3%). Other notables included: apparel (+2.6%), gas station sales (+2.5%), and food services (+2.3%). Those were partly offset by declines in vehicles (-2.0%), furniture (-3.6%), building materials (-1.6%), and sporting goods (-1.7%). Excluding vehicles, retail sales increased 1.3%, above the consensus of 0.5%.  


Semiconductors Set to Boom Amid Component Shortages

The market is overbought, and a correction is warranted. But again, as long as the HCM-BuyLine® is positive, which it clearly is, any pullback should be bought. We do expect the market to be even higher than it is now by year-end. 

Technology has been on a tear after lagging for most of the year. If you will recall, I have been steadfast in saying buy tech and stay overweight in tech, which is working very well for us. We took a large position in the semiconductor index, SOXX, this week. SOXX is starting to break out, and our quantifiable metrics are showing very favorable odds of this index/ETF moving higher in the near-term. 

The Vanguard real estate ETF, VNQ, is showing a strong uptrend on both its daily and weekly charts. Some sector rotation is clearly evident, and the sector is showing strong relative strength against the broader markets. Housing is becoming a hot commodity, and office space is still slow but should benefit from the reopening trade.

The Consumer Price Index (CPI) surged 0.9% in June, the most since June 2008, and nearly double the consensus of 0.5%. Similar to the past several months, more than 1/3 of the increase was attributed to a record 10.5% jump in used car and truck prices. That market has been hammered by stronger demand as the economy reopens and low inventory as the flow-through from new vehicles has been squeezed due to semiconductor and other component shortages. There is a case to be made that these disruptions are easing, as new vehicle production picked up in May and wholesale used vehicle prices, as gauged by the Manheim Index, declined in June for the first time this year.

Nevertheless, the increase in prices in June was broad-based. Food prices rose 0.8%, the second most since July 2008, with both food at home and away from home rising by more than in the previous month. Energy prices picked up 1.5%, led by gasoline. Core CPI, which excludes food and energy, jumped 0.9%, the second most since September 1981, and also above the consensus of 0.5%.

The predominant theme remains that inflation is driven by temporary demand/supply imbalances due to the reopening of the economy (i.e., stronger demand) and supply constraints (i.e., production bottlenecks, supply chain issues, labor shortages). The reopening theme was plenty evident in the components with the largest price gains, including vehicles, air fares, hotel rooms, and restaurant meals. As these imbalances are corrected over time, price pressures should subside, although the timing is uncertain. The Fed admitted as much in its latest Monetary Policy Report, released ahead of Chairman Powell’s testimony to Congress today and tomorrow, where price pressures were described as “more lasting but likely still temporary.” Combined with the Fed’s acknowledgement that the labor market has improved substantially in 1H 2021 and maximum employment may look different from the pre-pandemic period, this may move the Fed closer to tapering of its asset purchases.  


Privacy Settings
We use cookies to enhance your experience while using our website. If you are using our Services via a browser you can restrict, block or remove cookies through your web browser settings. We also use content and scripts from third parties that may use tracking technologies. You can selectively provide your consent below to allow such third party embeds. For complete information about the cookies we use, data we collect and how we process them, please check our Privacy Policy
Youtube
Consent to display content from - Youtube
Vimeo
Consent to display content from - Vimeo
Google Maps
Consent to display content from - Google