Category0

Markets Find Some Footing As Investors Adapt to Higher Rates and Higher Inflation
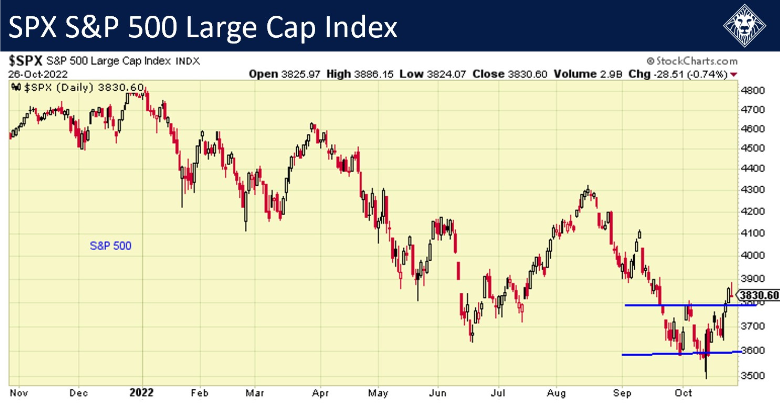
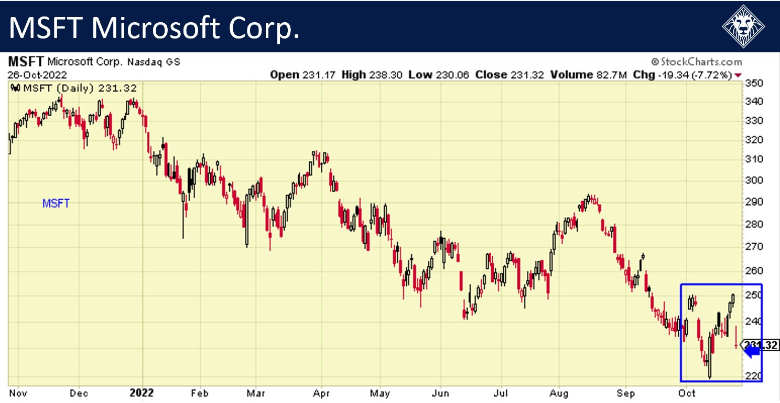
The markets are trading in a much better mood than they have in the past few months, with the price action looking a bit more positive. There is room for optimism as it looks like the markets are trying to find a base. Despite seeing some big stocks such as Microsoft, Alphabet, Inc., and Meta taking a beating over the last few trading sessions, the indexes like the S&P 500 and Nasdaq 100 have held up well. If a major holding like Microsoft is way down, which is one of the largest holdings in each index, but the index is holding up somewhat firm, that is telling us that most of the other constituents of the index have hit a bottom and are not going down as they were earlier in the year. This is a very encouraging sign for the markets.
Are we calling a bottom? Of course not, but there are signs of improvement. Remember, bull markets come and go, and so do bear markets. We are more than halfway through this bear market, and I would even go as far as to say we are 75% through it. There is a mountain of cash on the sidelines to fuel the next bull market for an extended period of time, and we believe a new bull market could emerge in 2023. We do see higher interest rates and higher inflation, but investors are adapting to both. A recession is almost a given, but has the market priced that in already? There are still some big questions going forward, but after the last week or so, there is no doubt that a change is underfoot. Investors should be alert to what could be a turn in the short and intermediate-term trends, which might provide some opportunities.

New home sales fell 10.9% in September to a 603,000-unit annual rate, beating the consensus estimate of 593,000. The decline followed a 24.7% jump in the prior month which represented the fifth largest increase on record, as homebuyers hurried to lock in current mortgage rates ahead of more rate increases. More broadly, new home sales have been down in seven of the past nine months, as falling affordability has weighed on demand. Regionally, sales data was mixed, with sales rising in the Northeast and Midwest, but declining in the South and West. On a y/y basis, sales were down 17.6% and were also mixed by region.

The new home inventory picked up 1.1% to 462,000 units, the highest level since March 2008. Months’ available supply increased to 9.2 from 8.1 in the prior month. While the number of completed units in inventory continued to recover, it is still far below its pre-pandemic level. Homebuyers gobbled up completed units. The median number of months from completion to sale fell to a new record low of 1.5, which shows that demand is still solid in spite of the highest mortgage rates in two decades.

Median new home prices increased by 8.0% from the prior month to $470,600, while mean new home prices fell by 2.1%. Both are still running at elevated y/y rates, with increases of 13.3% and 15.0%, respectively, but off the peak rates earlier in this cycle.


Bond Holders Continue to Feel the Pain

The market has been trading in a sideways pattern for the last three weeks, with no real direction either way. However, the overarching trend is still clearly down, and the markets look to be ready for a re-test of the lows set in September. Cash is king at this stage of the cycle, and we are sitting on a lot of it. Patience will pay off. This bear market will end; we just can’t be sure of when. The bond market is having the worst performance it has had in over 40 years. A lot of investors thought government bonds were safe. Well, they are safe if you hold them to maturity, but if you own 20-year treasuries you are down almost 34%, and it looks like they have even further to fall. We have very few bonds in our holdings, and the ones we do own are 1-month treasuries which are basically a notch above cash.

Housing starts fell 8.1% in September to a 1.439 million unit annual rate, below the consensus of a 1.47 million unit rate. Although the monthly changes have been switching between positive and negative territory this year, the trend in starts has been decidedly downward. September saw the second lowest level in starts since February 2021, while the three month average was the lowest since October 2020. The near-term outlook for starts is also dour, as builder confidence, which correlates strongly with starts, sank in October to its lowest level since 2012 (excluding the pandemic).

Single-family starts fell 4.7%, down in six of the past seven months, to an 892,000 unit annual rate, the lowest level since May 2020. Multifamily starts fell a larger 13.1% to a 530,000 unit rate, but held onto a broader upward trend. Indeed, the six-month average of multifamily starts hit its highest level since September 1986. Starts fell in three of the four regions, including in the South. There wasn’t a large discernable impact from Hurricane Ian which made landfall in Florida at the end of September. But construction activity will likely be affected in the coming months as rebuilding efforts ramp up.


Another Hot CPI Number Puts More Pressure On Pocketbooks

The market is in a very defined downtrend, and we are holding about 70-80% cash. This morning’s CPI (Consumer Price Index) number was a disaster. Wall Street’s hopes that the Federal Reserve might be able to ease up on its battle against inflation later this year were decisively dashed Thursday when consumer price index data for September came in unexpectedly hot. Core CPI, which excludes food and energy, increased 6.6% from a year ago, the highest level since 1982.

There can’t be anyone left in the market who believes the Fed can raise rates by anything less than 75bps at the November meeting. In fact, if this kind of upside surprise is repeated next month, we could be facing a fifth consecutive 0.75% hike in December, with policy rates blowing through the Fed’s peak rate forecast before this year is over.

The futures market sold off hard this morning but is staging a rally mid-morning. Unfortunately, after 7 down days, we believe this is most likely just investors covering their short positions, and once that fades so will the market.

One of the questions I have been asked the most in virtually every conversation for the past two months is about the mid-term elections. I have been saying people vote by their pocketbooks, and no one, and I mean no one, is better off than they were 12-24 months ago. It is simply impossible when inflation is at a 40-year high. Everyone is paying the price. The rich are less rich, the upper-middle class is dropping down to middle class, the middle class is dropping to lower-middle class, and the poor are just plain suffering.

Remember, elected offices are no more than your employee. In other words, they are a well-compensated manager. Ask yourself if your employee/manager in your district is doing the job you hired them to do. If not, maybe its time to find a new manager of your district.


Four Steps to Identify a New Bull Market

The markets staged a relief rally this week, giving hope the bear market is coming to an end. Unfortunately, the HCM-BuyLine® remains negative and the trend is still down. This did little to affect even the short-term trend, so odds are that this rally was driven by shorts covering and maybe some speculators trying to pick up deals. By the way, there are some great deals out there. Ask yourself this question: if you bought today, would you be happy you did three years from now? I’ll give you my answer to that question using odds. The odds of the market being higher three year from now are incredibly high, and I would say even as high as 90% or better. When you look at stocks like Wells Fargo, Qualcomm, Inc., even Apple and Microsoft are looking like very strong buys. Being patient and waiting until the trend changes is important. We are in a bear market and the probability of the markets selling off even more is very high.

Approximate Cash %

ALP Growth: 73%

Dividend Sector (HCMNX)*: 53%

Dynamic Income (HCMBX)*: 100%

Income Plus (HCMEX)*: 67%

HCM Defender 500 Index (LGH)*: 62%

HCM Defender 100 Index (QQH)*: 62%

Tactical Growth (HCMGX)*: 69%

Ultra Aggressive: 85%

*Click to view top 10 holdings

We are holding a lot of cash, and I have updated the table of cash positions in our funds as well as a couple of models. As you can see and as I have been saying, we are well-positioned to take advantage of a new bull market. And yes, there will be a new bull market; the only question is when.

The four-step process to a new bull market is: oversold, rally, retest, and finally a move above the HCM-BuyLine®. Retests are the third step in the four-step bottoming process because whether the recent bounce is going to be sustainable or not is still a very big question.

On the weekly chart of the S&P 500 you can see we are testing the 200-day moving average on a weekly basis. Could this be a classic retest of the lows set 6/17, or is there still more downside to come?

I found this chart very interesting. It shows that midterm years see a large pullback, but returns a year later are great.

Source: LPL Research Factset 1/10/22


Markets Falter on Day Two of British Bond Buying

There was a rally yesterday when the Bank of England bought 1.415 billion pounds ($1.55 billion) of British government bonds with maturities of more than 20 years; the second day of a multi-billion pound program designed to stabilize the markets. But today the markets continued to trade in a very violent manner and came down to re-test the 3,600 area on the S&P 500.

I had a meeting today with a friend of mine who is a Principal at GTS Securities. He told me he had lunch last week with Jamie Dimon, the CEO of JPMorgan, and asked him his thoughts on the market. He stated there was over two trillion dollars of household cash on the sidelines. This is obviously a big number and could help put a damper on a recession. That is not to say that we are not going into a recession, but it could help with a soft landing.

The bond market has sold off and has some more room to the downside, but bonds are starting to look like they could be a buy in the not-too-distant future. Be patient, the bond market will come back at some point, just not today.

Initial claims for unemployment insurance dropped 16,000 last week, down in six of the past seven weeks, to 193,000, the lowest level since April. This was below the consensus of 215,000 claims and followed a downward revision of 4,000 to 209,000 claims in the previous week. The four-week average of claims fell 8,750 to 207,000, a four-month low. The trend is only modestly above its cycle low back in April and is hovering near its pre-pandemic level.

Additionally, continuing jobless claims in the prior week fell 29,000 to 1.347 million, its lowest level since mid-July and near its lowest since 1970, while the insured jobless rate was unchanged at 1.0%, close to the record low of 0.9%. This report reflects that labor demand remains strong, despite aggressive efforts by the Fed to tighten financial conditions and cool down the economy. But the Fed policy impact on labor market conditions comes with a significant lag, is more pronounced in fast tightening cycles, and varies by industry. We find that the real fed funds rate leads private sector payroll growth by 12-18 months. It implies softer labor market conditions by the spring of 2023, and elevated risk of recession also around that time.


A Primer On Whipsaws and Reactive Indicators

I was asked the other day if I thought the HCM-BuyLine® has done its job in this bear market and my answer, with no hesitation, was a resounding YES. In this week’s Wealth Watch I’m going to do a postmortem of the last 9 months and review the last 20 years of the HCM-BuyLine®, so buckle up.

Like everyone else, we experienced a sharp drop in the first 19 trading days of 2022. We were long growth and tech, which was exactly were we should have been considering they were clearly the strongest sectors going into 2022. In the first 19 days, growth and tech dropped almost 15% in that short window. The HCM-BuyLine® fired off a signal to reduce exposure to equities on January 21st, which we did. Remember, and this is important, the HCM-BuyLine® is a reactive indicator, not a predictive indicator. I only know one manager who had a successful predictive indicator, and that was Bernie Madoff, and he is no longer trading. No one can predict what will happen in the markets. They can guess, but that is not a reliable system. Guessing is like someone telling you they know what the weather will be on March 26th, 2023, at 9:46 am. Good luck with that.

The HCM-BuyLine® is a trend indicator and it is a reactive indicator, meaning the market must move in one direction or the other for a period of time before it will adjust. It has two settings, one which is slow to activate and tell us when to exit the market. Why is it slow to turn negative? Because most markets like to trend higher, and we want to stay invested as long as we can to catch as much of the uptrend as possible. This also helps reduce the whipsaw effect. What is a whipsaw?  It’s a fast process that begins with the market moving higher and creating a buy signal on the HCM-BuyLine®. Then, buys are placed, only for the market to roll over and stop us out because the trend did not hold and turned back down. As much as I hate being whipsawed, it is part of the game. No matter how hard you try to eliminate them, they will happen. And it has happened to us twice this year, which I have identified in the chart.

The second setting is designed to provide a much faster signal to re-enter the market with as much gun power as we have, which is our cash buildup. Why? Because we are trying to catch as much of the early stages of new bull markets as possible. We do not try to catch the bottom, but we do try to get as close as possible. In starting to re-enter a beginning phase it can produce a whipsaw effect from time to time, but when the market does turn back up and a new bull market has begun, you can bet we will have moved back in as close as we could to the beginning of new uptrend, and hopefully a prolonged bull market.  

I have included additional charts of actual trends the HCM-BuyLine® has identified and the results it has produced. From 1-1-2011 to now, we had five HCM-BuyLine® calls to reduce exposure to equities and you can see the change in trend on the chart. I have also highlighted the pandemic trade where the HCM-BuyLine® was a very productive indicator during this almost insane period. You can see the trend turned down in early March and pushed us to reduce exposure to equities, as well as a new uptrend emerging about 4 weeks later causing us to move back into equities. Was this comfortable?  NO! It was a very uncomfortable trade, especially when the Imperial College was saying half of the people on the planet were going to die. But, this is why a non-emotional indicator like the HCM-BuyLine® can be so important. Again, the HCM-BuyLine® never called a top or bottom. It simply cannot do that because it is a reactive indicator.


Approximate cash build up as of last night:

Dividend Sector: ~55% cash

Tactical Growth: ~50% cash

Income Plus: ~65% cash

Dynamic Income: ~87% cash

QQH: 60% cash

LGH: 60% cash

ALP Growth: ~65% cash

Also, playing the all or non-game of 100% in cash and out of the markets is a fool’s errand. The only time we will go that far to cash is if the banking system is imploding like 2008 in which we were 100% in cash. And that move is documented. There is no dinner bell saying it’s all clear to invest.

What can you expect going forward with the HCM-BuyLine® being negative? The markets could fall even further, possibly retesting the 3600 area on the S&P 500. We are sitting on more cash than any other Wall Street firm of our size that I know of, and when the HCM-BuyLine® does turn positive there will be a lot of bargains to be had. The beginning phase of a new bull market is usually very powerful and the recapture of the drawdown we are experiencing is usually made back up at an expedited pace. With the very large cash buildup we have, this creates a lot of opportunity for all of us.

I wish bear markets never happened, but they do, and drawdowns and volatility are part of investing. Not just for us, but for everyone.


Markets Remain Uncertain After Unexpected Inflation Numbers

The markets sold off hard on Tuesday, with the CPI data being hot. The September CPI reflecting August 2022 inflation data came in at 8.3%, which was higher than the consensus forecast but lower than the two previous readings. A 75-bp rate hike from the Fed is almost certain for September, and rates are likely to reach the 4% range by EOY 2022. This will cause a lot of volatility over the next two to three weeks. We are holding a large cash position, but opportunities are few and far between.

The Consumer price Index or CPI is a measure of the weighted average change over time in the price of a fixed basket of goods commonly purchased by U.S. consumers. The CPI is the most widely followed measure of U.S. inflation and is calculated by the Bureau of Labor Statistics, or BLS.

The Consumer Price Index (CPI) ticked up 0.1% in August, contrary to the consensus of -0.1%. While energy prices declined 5.0%, down for the second consecutive month, that was insufficient to offset the increases in most other categories. Even in energy, the decline was only in gasoline prices, while electricity and natural gas prices rose. Food prices advanced 0.8%, the least this year, but nearly four times the average monthly gain since 1990. Core CPI, which excludes energy and food, increased 0.6%, twice the gain in the previous month, and above the 12-month average of 0.5%. The consensus was for a steady 0.3% gain in the core.

The biggest driver of the monthly change in the core CPI was shelter, which has a weight of over 40% in that index. Rent and owners’ equivalent rent (OER) each rose 0.7%, which for OER was the biggest gain since June 1990. Despite the decline in housing market activity this year, softer home prices are reflected in the CPI with a significant lag, and will remain a source of higher inflation this year. Medical care services prices jumped 0.8%, the most since October 2019, led by hospital services. Household furnishings and operations climbed 1.0%, the most since January. New vehicle prices rose 0.8%, picking up from the prior month’s 0.6% gain. There was a partial offset from modest declines in the prices for used cars and trucks (-0.1%), communications (-0.2%), and airline fares (-4.6%).

On a y/y basis, the CPI eased only slightly to 8.3% from 8.5% in the month before, missing the consensus of 8.0%. Notably, food prices surged 11.4% from a year ago, the steepest rise since May 1979. Food at home prices jumped an even bigger 13.5% y/y, also the most since 1979. Core CPI climbed 6.3% y/y, above the consensus of 6.0%. Because of base effects, a 0.3% monthly increase in the core CPI in September would be sufficient to lift the y/y change to match its cycle high from earlier this year. If this were to materialize, it will strengthen the case for continued aggressive Fed tightening in upcoming policy meetings.


Bitcoins and Bonds and Bears, Oh My!

The market has traded down ever since Fed Chair Powell was at the conference in Jackson Hole. The HCM-BuyLine® has weakened and we had some stops hit which further reduced our exposure to equities. While trading this market you will have to be fast, and your expectations should be for small gains if you’re a shorter-term trader. We are holding a lot of cash, and patience is a virtue in markets like this. This market is not much different than any other bear market we have had to work through, with one exception being bonds. The bond market is getting clobbered, and I don’t see any reason for that to stop any time soon outside of some short-term relief rallies. Our fixed income/bond fund HCM Dynamic Income is approximately 87% in cash. We barely own any bonds at the moment. Bonds used to be a great place to trade when the stock market was doing poorly, but not anymore. The 20-year treasury ETF (TLT) is down a whopping 26%, and that is government-backed bonds.

Bitcoin is down and looking to test support in the 18210 area. If this area of support is broken, you could see Bitcoin sell off to the 12500 area, and I would not be surprised if that happens. This has been a breathtaking drop from around 67000, to where it is now at 18920. We do not own any Bitcoin currently and when we have, we have used ETFs and been very quick to take profits.

Nonfarm payrolls expanded by 315,000 in August, in line with expectations of 318,000 and 20,000 below our forecast. But the prior two months were revised down by 107,000, for a net gain of 208,000, bringing payrolls back to trend. The workweek ticked down by 0.1 hour. Average hourly earnings rose 0.3%, below the consensus of 0.4%. That left the y/y change at 5.2%, below forecasts of 5.3%. The unemployment rate rose to 3.7%, above the consensus and our forecast for an unchanged reading of 3.5%, and above all economist forecasts. That’s because the participation rate rebounded from 62.1% to 62.4%, matching the March high for the year, and was above our estimate of 62.2%. Although these are welcome signs of cooling in the labor market, they are not sufficient to deter the Fed from a more aggressive 75 bp hike later this month should the CPI report come in line with expectations.

June payrolls were revised down by a rather large 105,000. Typically, you don’t see such a large downward revision in the middle of strong jobs growth. In fact, the downward revision between the second and third prints for that month was the most since March 2020, which was the biggest since the start of the GFC in September 2008 when the labor market was already hemorrhaging jobs. In the establishment survey, private payrolls increased 308,000, the fewest since April 2021, and below the 443,000 average gain the first seven months of this year. While this indicates a notable moderation in payrolls growth, it is far from recession territory.


HCM-BuyLine® Trend Weakening As Powell Startles The Markets

After Fed Chair Powell’s speech last week, he sent the markets into a tailspin. We are now oversold; the markets are trading in sawtooth patterns which is stocks moving higher and then pulling back as traders take part of the gains and resetting. We never expected a V-shaped recovery. I stated last week “The odds of us retesting the July lows are very low and the odds of volatility scaring investors is very high.” and that has been the case. We are sitting on a lot of cash, and if the market continues to sell off, we will likely hit some stops and will build up even more cash. Markets like this are extremely volatile, and the short and intermediate-term trend as identified by the HCM-BuyLine® is weakening. However, the VIX (Volatility Index) is overbought, indicating that a relief rally could be in the making. As always, we will monitor for any adjustments to the portfolios.

The Personal Consumption Expenditures (PCE) Price Index fell 0.1% in July, its first decline since April 2020. Energy was a big driver, down 4.8% for the month. Food prices, however, increased 1.3%. Core PCE, which excludes energy and food, ticked up 0.1%, the smallest gain since November 2020, and below the consensus of 0.2%.

On a y/y basis, PCE inflation eased to 6.3% from a peak rate of 6.8% in the previous month. With energy price growth moderating, the PCE price index for nondurable goods slid to 11.8% y/y from 13.0% y/y. But slower headline inflation was about more than just energy. Durable goods price growth continued to ease, down to 5.6% y/y, the least since April 2021, while services price growth edged down to 4.6% y/y from a peak rate of 4.9% in the month before. Core PCE inflation, which had reached a cycle high at 5.3% y/y back in February, eased to 4.6% y/y last month, the lowest rate since October 2021, and below the consensus of 4.7%.

Even though inflation has backed off from recent highs, it is still historically elevated, with headline inflation running close to its highest level since 1982, and the core near its highest level since 1989. It is still well above the Fed’s average inflation target of 2.0%, keeping monetary policy in restrictive territory. While a data-dependent Fed will not pre-commit to a set number or size of rate hikes, we continue to expect a terminal fed funds rate of 3.50%-3.75% either late this year or early next year, as Joe Kalish discussed in the 8/25/2022 Fixed Income Focus. At that time, the Fed may reassess its policy progress and impact on the economy, but talk of a hard pivot to rate cuts seems premature, given the uncertainty around the path of future inflation and the remarks by Chair Powell at the Jackson Hole Summit on August 26th.


Privacy Settings
We use cookies to enhance your experience while using our website. If you are using our Services via a browser you can restrict, block or remove cookies through your web browser settings. We also use content and scripts from third parties that may use tracking technologies. You can selectively provide your consent below to allow such third party embeds. For complete information about the cookies we use, data we collect and how we process them, please check our Privacy Policy
Youtube
Consent to display content from - Youtube
Vimeo
Consent to display content from - Vimeo
Google Maps
Consent to display content from - Google