Category0

Market Gymnastics – Bouncing Markets And How To Navigate Them
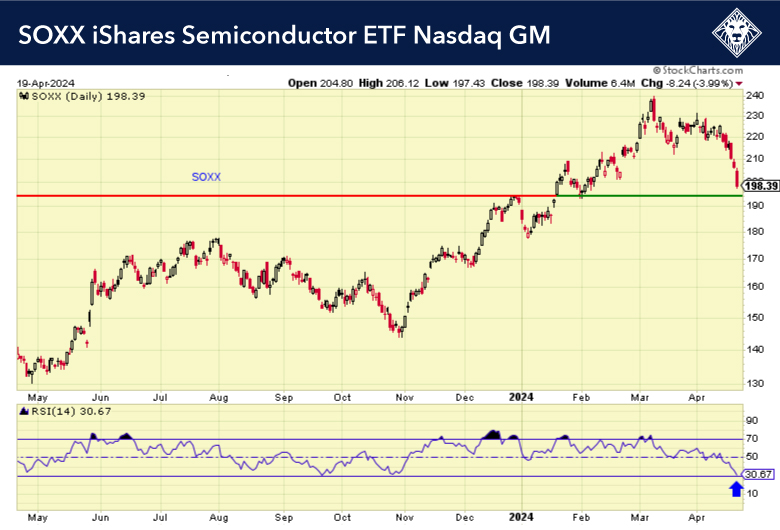
4-22-24-SOXX

Chart: SOXX 1-year daily

The markets sold off just as we had predicted, which should not surprise anyone after a very long stretch of positive weeks. We moved about $1.1 billion to cash and one-month T-bills at the beginning of the selloff due to several HCM Pivot Points being hit. This gives us a lot of buying power when the market turns back up. The intermediate-term trend, as identified by the HCM-BuyLine® is still positive, but has weakened, and we are monitoring closely. We believe the selloff has created many opportunities, and we will be watching for the HCM Pivot Points to turn back up so we can start buying some of them. One area of extreme interest is semiconductors (SOXX).

4-22-24-SPY

Chart: SPY 1-year daily

Seasoned traders also look for what is called a 50% retracement, and I have added a chart of the S&P 500 where you can see that it is getting closer to that level. We think there will probably be a few up-days followed by additional selling pressure before the market finds a place of support. The markets are deeply oversold on a short-term basis, so a modest bounce should most likely be coming. The market will take a little time to work through the technical damage of the current selloff, so don’t expect a straight shot back up, but rather a slow grinding process, which is healthy.

Short-Term Turmoil – Can the market keep pushing?

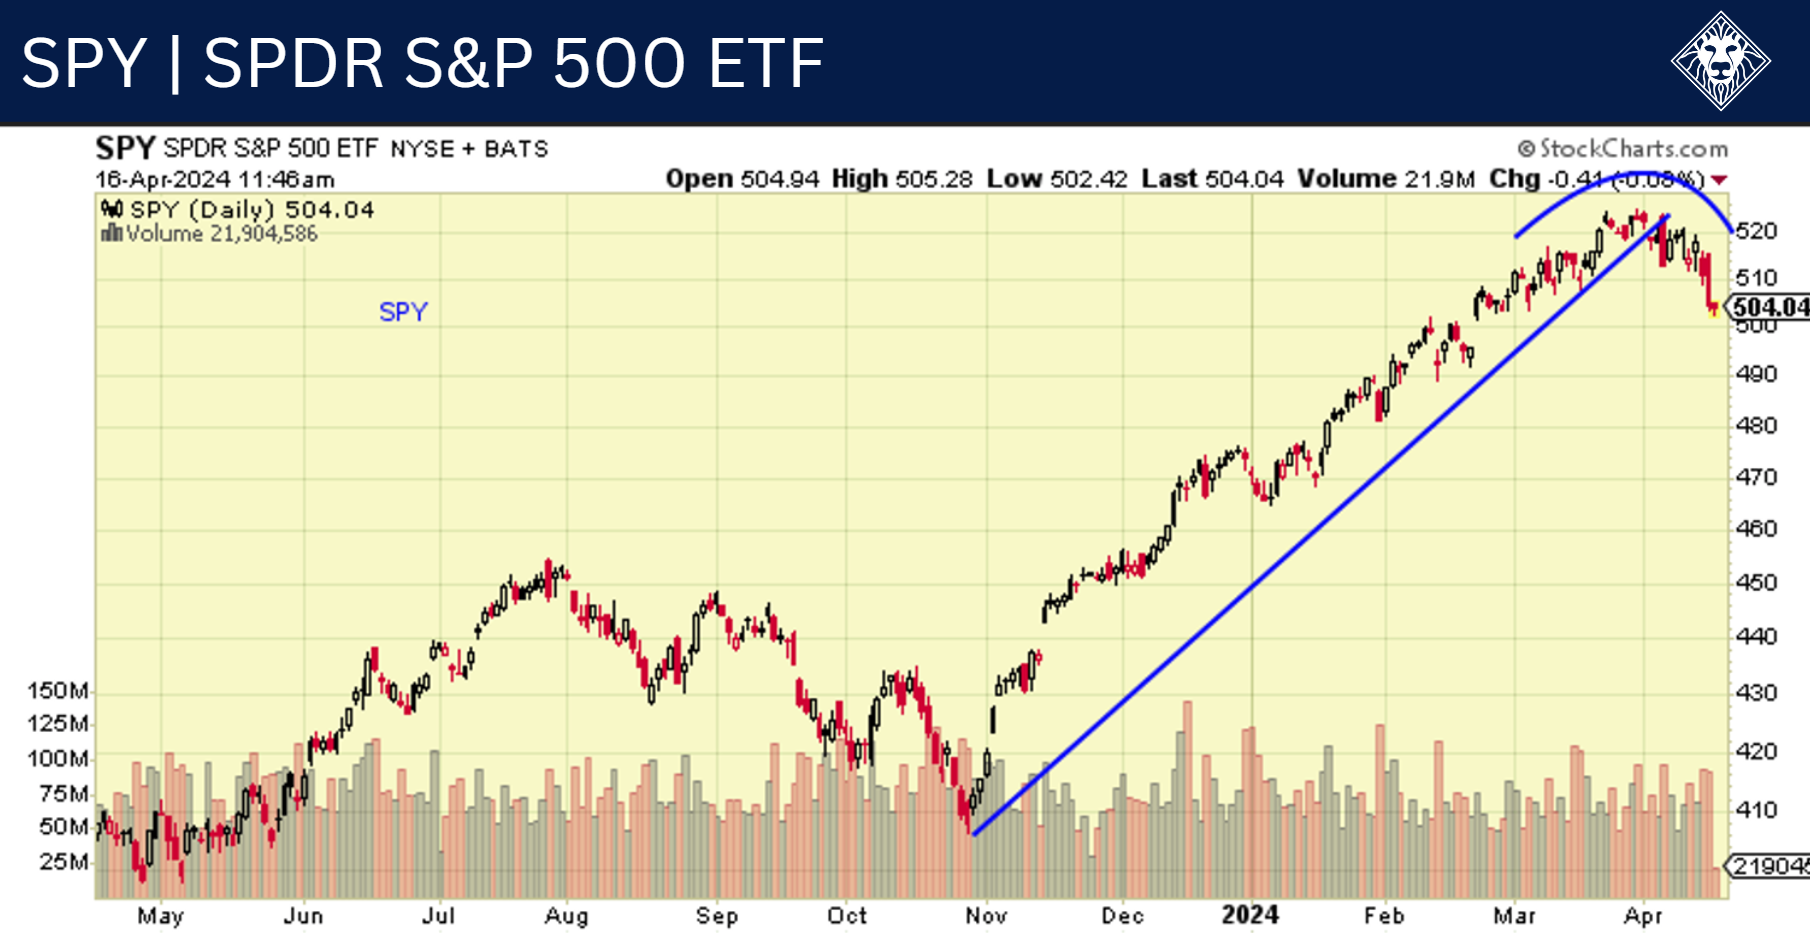
SPY

The S&P 500 has pulled back and closed below its 50-day moving average, indicating a structural breakdown. We remain bullish, but a short-term correction is likely underway. Investors are de-risking and moving money to cash and/or short-term bonds. Does this change our view of the S&P 500 closing above 5500 this year? No, we still anticipate stocks moving higher.

Geopolitical risks are clearly at play, but looking at the upward move of the S&P 500 a pullback was warranted, and a period of consolidation was needed. With the market breaking below the 50-day moving average, some short-term damage has been done and will need to be repaired for the market to continue its climb.

So far earnings are looking good. 42 companies are reporting this week, and of the 34 companies that have reported so far (7% of the S&P 500): Overall, 85% are beating estimates, and those that “beat” are beating by a median of 9%. Of the 15% missing, those are missing by a median of -4%. On the top line, overall results are beating estimates by a median of 3% and missing by a median of -2%, and 56% of those reporting are beating estimates.

Retail sales increased 0.7% in March, more than double the consensus estimate of 0.3%. Additionally, the previous month was revised up to 0.9% from 0.6%, fully erasing the weather-related drop at the start of the year. It confirms the economy has ended Q1 with strong consumer demand, which partly explains elevated inflation. Strong growth and relatively high inflation have pushed off market expectations for Fed rate cuts until later this year.


Market Momentum – Zooming Ahead or Bracing for Trouble?

4-9-24-SPY

The market continues to trade in a strong upward channel, but we think it is currently overbought and a pullback will most likely occur. This should be considered a buying opportunity, as we see the market moving higher throughout the year. Energy has been moving higher with the instability in the Middle East and has the potential to keep inflation from dropping, as all hope it will.

In Q4, U.S. economic growth exceeded previous estimates, with real GDP rising to a 3.4% annualized rate. Upward revisions to consumer spending, business investment, and government spending were partly offset by decreases in inventories and net exports. Real final sales to domestic purchasers, excluding inventories and net exports, increased to a 3.5% annualized rate, indicating robust domestic demand. This trend suggests continued growth in the near term, supported by a drop in our recession probability model. Fiscal stimulus exceeding $5 trillion during the pandemic, alongside ongoing government support, has kept the economy expanding, driving inflation. Despite the Fed raising rates in March 2022 to counter inflation, the economy grew beyond potential in the second half of 2023. With inflation persisting above 2%, there’s concern that any Fed easing could risk overheating the economy, especially as fiscal policies like the Infrastructure Investment and Jobs Act continue to support growth. While supportive for equity markets historically, such policies may exacerbate inflation if they push growth beyond capacity.

The Consumer Price Index for All Urban Consumers (CPI-U) increased 0.4 percent in February on a seasonally adjusted basis, after rising 0.3 percent in January, the U.S. Bureau of Labor Statistics reported today. Over the last 12 months, the all items index increased 3.2 percent before seasonal adjustment.

The index for shelter rose in February, as did the index for gasoline. Combined, these two indexes contributed over sixty percent of the monthly increase in the index for all items. The energy index rose 2.3 percent over the month, as all of its component indexes increased. The food index was unchanged in February, as was the food at home index. The food away from home index rose 0.1 percent over the month.

The index for all items less food and energy rose 0.4 percent in February, as it did in January. Indexes which increased in February include shelter, airline fares, motor vehicle insurance, apparel, and recreation. The index for personal care and the index for household furnishings and operations were among those that decreased over the month.

The all items index rose 3.2 percent for the 12 months ending February, a larger increase than the 3.1-percent increase for the 12 months ending January. The all items less food and energy index rose 3.8 percent over the last 12 months. The energy index decreased 1.9 percent for the 12 months ending February, while the food index increased 2.2 percent over the last year.


Riding the Wave: Navigating Fed Meetings and Inflation Surprises

3-18-24-CWB

Chart: CWB 1-year daily

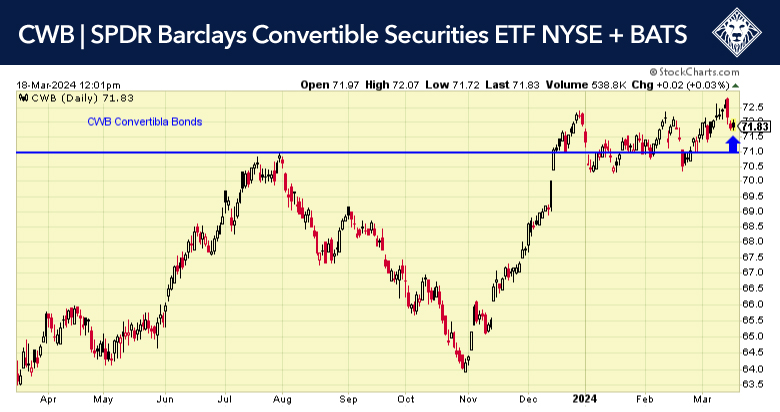
The HCM-BuyLine® is positive and pullbacks should be seen as a buying opportunity. Yes, this market does feel a bit overextended as it reaches a nice 20-week run-up, but there is still $6.1 trillion on the sidelines, and that’s a staggering amount of liquidity. The technicals look good and inflows have been positive.

Historically, 10-year Treasury yields have declined from three months before the first rate cut to the first rate cut by a median 72 bps and a minimum of 38 bps. We are 110% for benchmark duration. Long-term support can be found from 5.00% to 5.25%. Short-term support can be found from 4.35% to 4.50%. Short-term resistance is around 3.75%.

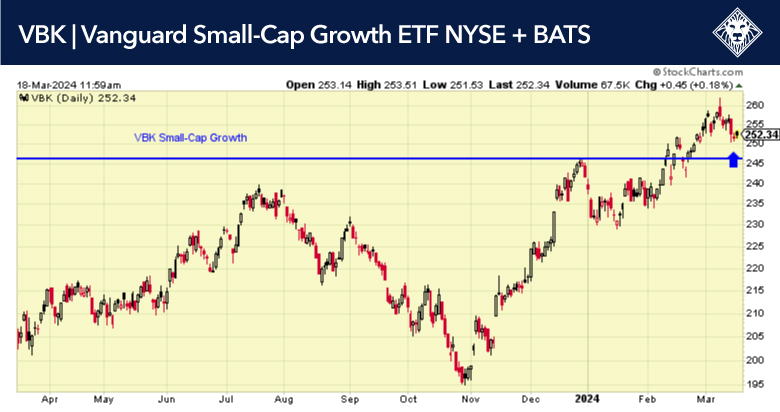
3-18-24-VBK

Chart: VBK 1-year daily

The Fed is done raising rates for this cycle, but it will be restrictive for longer. ​We expect the first rate cut in Q2, probably in June.

This Tuesday and Wednesday the Fed’s Federal Open Markets Committee (FOMC) meets to determine interest rate policy.  Chair Powell and most of the “Fed speak” has indicated that there will be no changes in rates at the March meeting.

At the end of the meeting at 2:00pm on Wednesday the Board releases an official statement which gives the rate policy of the Committee.  At 2:30 Chair Powell conducts his always important press conference.  What makes the Chair’s presser so interesting is that he knows that three weeks later the minutes of the meeting will be released, and any inconsistencies between the Chair’s post meeting comments and the minutes will obviously stir issues for Powell and raise questions at the next post meeting press conference.

CPI inflation came in slightly above expectations in February, driven by higher energy and rent prices. Underlying price pressures showed few signs of easing. The three-month annualized rate of change of core CPI picked up 4.2%, the most since last May. Super-core inflation barely eased to 4.3% y/y from 4.4% y/y in the month before, still running much higher than pre-pandemic. Such firm underlying price pressures are not conducive to Fed rate cuts. Although market expectations still favor the next easing cycle to begin in June, the risk is of later or fewer rate cuts than currently priced in, if inflation pressures persist

The Consumer Price Index (CPI) increased 0.4% in February, the most in six months, and matching the consensus. Food prices were flat, while energy prices rebounded 2.3%, up for the first me since September, led by gasoline. Excluding food and energy, core CPI also rose 0.4%, practically the same as in the prior month, and above the consensus of 0.3%.


Markets Remain Strong As Economy Continues to Expand

2-28-24-SPY

The markets are strong, the HCM-BuyLine® is positive, and pullbacks should be seen as buying opportunities. Technology, small caps and the financial sector are what we see as the three areas that could have higher odds of outperformance in 2024.

The growth rate of the U.S. economy in the fourth quarter was downgraded slightly to a 3.2% annual pace, but the economy is still expanding at a rapid clip and showing few signs of slowing down. Originally the government said gross domestic product had expanded at a 3.3% rate in the final three months of 2023. The figure is adjusted for inflation.

41 companies are reporting this week. Of the 474 companies that have reported so far (95% of the S&P 500): Overall, 77% are beating estimates, and those that “beat” are beating by a median of 7%. Of the 23% missing, those are missing by a median of -6%.

The Conference Board’s Consumer Confidence Index fell 4.2 points in February to 106.7, below the consensus of 115.1. This was the first decline in four months, and came on the back of a downward revision to the previous month, indicating that the increase in confidence around the turn of the year was less than previously thought. Nevertheless, the level of confidence is still higher than a year ago and remains consistent with continued economic expansion.

In February, confidence declined across most demographic and income categories. Both the present situation and consumer expectations weakened. Current business and labor market conditions softened, but remained in net positive territory. Expected business conditions and job availability, however, worsened and both were in net negative territory. Even so, consumer income expectations improved.

Likely related to the more positive outlook for income growth, consumer purchasing plans for autos and appliances in the next six months improved, and they did so by more than typical for this time of year. Home buying plans, however, continued to weaken, edging down to their lowest level since July 2022

Inflation expectations for the next 12 months edged down, but continued to run higher than pre-pandemic.


New CPI Print Brings A Reality Check To The Markets

2-13-24-SPY

Chart: SPY 1-year daily

The HCM-BuyLine® remains strong. The markets were overbought, and a pullback was warranted. The CPI number was just the nudge the market needed to cool things off a bit.

The Labor department CPI showed a 0.3% rise in prices vs. the 0.2% increase expected. The year-over-year number rose to 3.1% vs. the 3.0% projected. The January core number, which strips out food and energy, increased 0.4% vs. the 0.3% forecast. On an annual basis, prices rose 3.9% vs. the 3.7% prediction.

Stocks felt the impact. The Dow declined 1.2% in the first hour of trading on Tuesday. The S&P 500 also pulled back 1.37% on the stock market today, sending the benchmark index back below the 5,000 level.

The Conference Board’s CEO Confidence Index rose seven points in Q1 to 53, above 50 for the first time in two years, indicating growing optimism among executives. Both current conditions and expectations for the year ahead improved. CEOs had a net positive assessment not only of the broad macro economy but also of conditions in their own industries.

Despite the more positive economic outlook, hiring plans for the next 12 months declined. The share of CEOs who plan to lay off workers jumped to 23% from 13% in the previous quarter, while those who plan to grow their workforce slipped to 35% from 38%. The report attributed this net decline in hiring plans to be letting up of labor hoarding that characterized most of last year. It suggests a moderation in labor demand and easing in labor market conditions in 2024. Within the context of a continued economic expansion, however, this implies sustained productivity gains, and is a tailwind to profit and margin growth.

In special questions, CEOs identified political uncertainty ahead of the U.S. presidential election as their main challenge this year. Global downside risks included the spread of current wars, deglobalization, and U.S.-China tensions. Upside risks included falling inflation, Fed rate cuts, and a resolution to current geopolitical conflicts.


Bumpy Runway – How to Navigate Market Turbulence

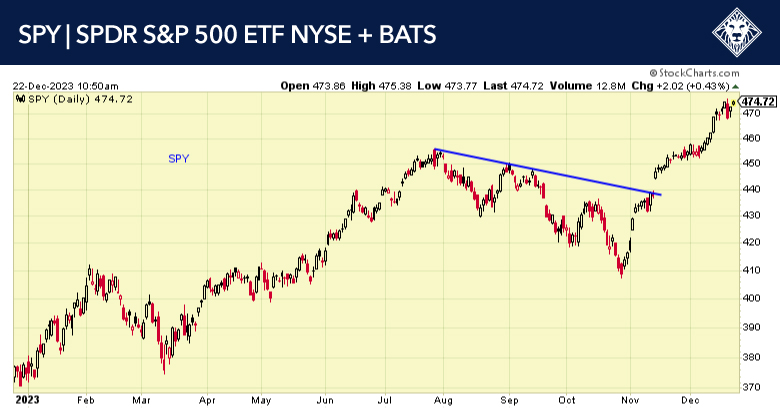
1-17-24-SPY

Chart: SPY 1-year daily

The market is trading in an erratic mode, trying to find its footing after 2023. No real surprise, a period of consolidation is warranted and needed for the market to move higher. The markets are overbought, and until the trough is worked off, we expect a halt to progress for a short period of time. The HCM-BuyLine® is positive, and we are bullish, but we expect gains to be primarily made after the second quarter and into the later part of the year.

This is consistent with our 2024 year-ahead outlook, where we expect the bulk of gains to be made in the second half of 2024. That is because the first half has many unknowns that the market likely struggles with. But the two biggies:

  • Soft or hard landing → today’s weak Empire regional survey = fuels fear
  • When does Fed cut? → equity markets will get anxious about timing
1-17-24-TLT

Chart: TLT 1-year daily

We reduced exposure to bonds early this year as the bond market started to turn over, and we have cash waiting for a bond trade to set up. Interest rates have climbed just a bit with some mixed news on inflation in the last two weeks. We do expect the bond market to be very active this year, and we do see a lot of opportunity in this area.

CPI inflation surprised to the upside in December, largely driven by persistent shelter price growth. Services ex-energy and shelter inflation, or the super-core, Chair Powell’s preferred gauge of underlying price pressures, also picked up at yearend and continues to run at about double its pre-pandemic pace. While inflation has made great strides down from its peak in 2022, it ended 2023 well above the Fed’s target of 2.0%. Given some upside risks from a rebound in existing home prices, tight labor markets, and geopolitical conflicts that may raise transportation costs and disrupt supply chains, the disinflation path ahead will likely be slower and choppier. This is not conducive to a Fed rate cut in March. We continue to expect the first cut to come in Q2, most likely in May.

The Consumer Price Index (CPI) increased 0.3% in December, the most in three months, and above the consensus of 0.2%. Energy and food prices were up 0.4% and 0.2%, respectively. Excluding energy and food, the core CPI also rose 0.3%, matching expectations.


$240 Billion On the Sidelines – Is a Santa Claus Rally Coming to Town?

The Nov Core PCE Deflator was released today and came in at +0.06% MoM, well below Street consensus of +0.20%. The key takeaway is that inflation is falling like a rock. One can look at Core PCE MoM since the start of 2023 and the sustained downtrend in this reading is clear. October was the first month since March 2021 that the annual PCE price index was below 3%. This was a very good number for equities and bonds. It’s our opinion that the Fed will be forced to drop rates at least 3 times, if not more, in 2024. As interest rates drop, more of the cash sitting on the sidelines could be put to work in 2024, and we think it could be going into equities and bonds. The bond trade is looking very good to us, as The HCM-Pivot Point® turned up in treasuries in late October and has been marching forward ever since.

Generally, we expect equities to strengthen into year-end over the next 5 trading days. First, it is the start of the “Santa Claus” rally period from the last 5 days of the year into the first two days of the following year. With $240 billion pulled from equities in 2023 and now sitting in money market and short-term bonds, there is a lot of buying power, and positive momentum remains in place. So, we are constructive into year-end.


Market Broadening – Could Dovish Fed Comments Boost 2024 Gains?

23-11-30-IWM

Chart: IWM 1-year daily

The market is looking stronger going into December. Technology has been the place to be, which has been the theme of 2023. There is a broadening out going on, as you can see from the iShares Russell 2000 ETF (IWM) turning back up. This is looking like a market that could carry over into 2024 and be quite strong to the upside. 

Fed Gov Christopher Waller, a known hawk, made surprisingly dovish comments Tuesday at the American Enterprise Institute. The two most notable are that he is “increasingly confident we can get inflation back to 2% without a sharp rise in the unemployment rate.” And if the inflation decline continues “we could start lowering the policy rate just because inflation is lower.”

These are surprisingly dovish views and consistent with our take for the past few months. Waller’s first comment is “no landing”, not even a soft landing, and the idea of cutting rates is the opposite of the entrenched consensus of “higher for longer”.

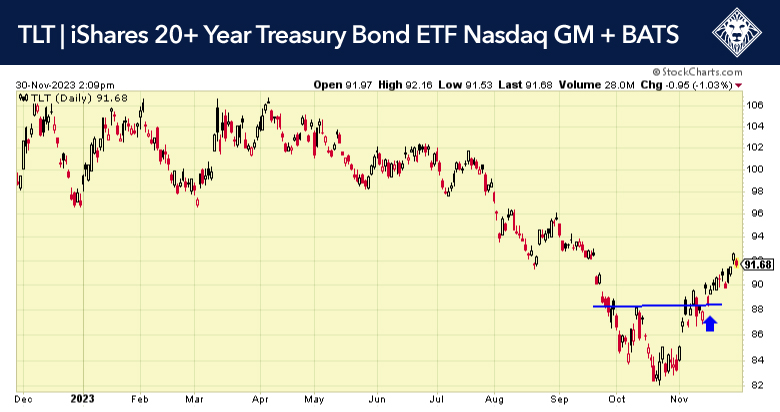
23-11-30-TLT

Chart: TLT 1-year daily

Inflation is tracking lower than consensus and the Fed expected. Thus, interest rates could fall next year to prevent “over-tightening.” This would be a positive surprise for markets and could put downward pressure on interest rates, which in turn is good for stocks. Bonds have responded positively, as you can see from the 20-year treasury ETF’s (TLT) pivot up.

The 10-year yield responded to this, falling sharply on Tuesday to 4.334%, the lowest in nearly three months. Similarly, the VIX fell to 12.69, the lowest basically for the year. These two markets exert quite a lot of influence on equities. Thus, it is important to note these moves.

The economy was even hotter in Q3 than previously estimated. Real GDP growth was revised up to a 5.2% annualized rate from 4.9% initially, the biggest gain since Q4 2021, and above the consensus for an unchanged reading. There were notable upward revisions to capex, residential investment, and government spending that were partly offset by a downward revision to consumer spending. On a y/y basis, real GDP was up 3.0%, exceeding the 2.4% gain per annum in the previous expansion.


Privacy Settings
We use cookies to enhance your experience while using our website. If you are using our Services via a browser you can restrict, block or remove cookies through your web browser settings. We also use content and scripts from third parties that may use tracking technologies. You can selectively provide your consent below to allow such third party embeds. For complete information about the cookies we use, data we collect and how we process them, please check our Privacy Policy
Youtube
Consent to display content from - Youtube
Vimeo
Consent to display content from - Vimeo
Google Maps
Consent to display content from - Google