Category0

Small Caps, Big Moves – Trends Worth Watching
11-14-24-SPY

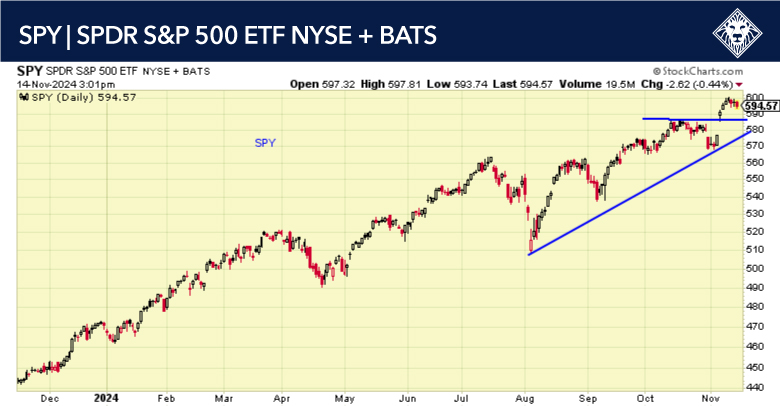
Chart: SPY 1-year daily

The market is a bit overbought and may need a brief period to consolidate, but any pullbacks should be considered buyable events at this point. We are expecting the market to move higher into year-end. I think it is very possible we could see as much as a 5% or more rally before the end of the year. With the Trump agenda – lower regulation and keeping taxes where they are, or possibly lowering them – investors are, and should be, very optimistic.

11-14-24-IBIT
11-14-24-IBIT
previous arrow
next arrow

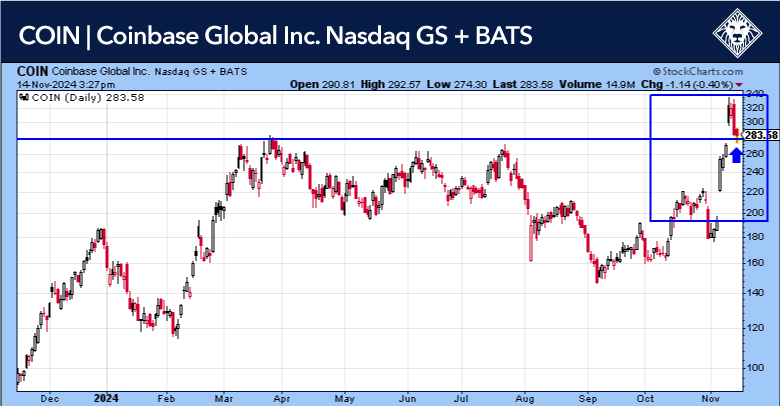
Chart: IBIT and COIN 1-year daily

The cryptocurrency industry bet big on the election of Donald Trump, and crypto assets have rallied in the days since he secured a second term in the White House. Crypto companies will likely be looking for Congress to pass crypto legislation, along with new leadership and a friendlier stance at the SEC. Look at (IBIT) if you’re looking for a Bitcoin ETF, and if you prefer individual stocks, take a look at (COIN) Coinbase Global.

11-14-24-KRE

Chart: KRE 1-year daily

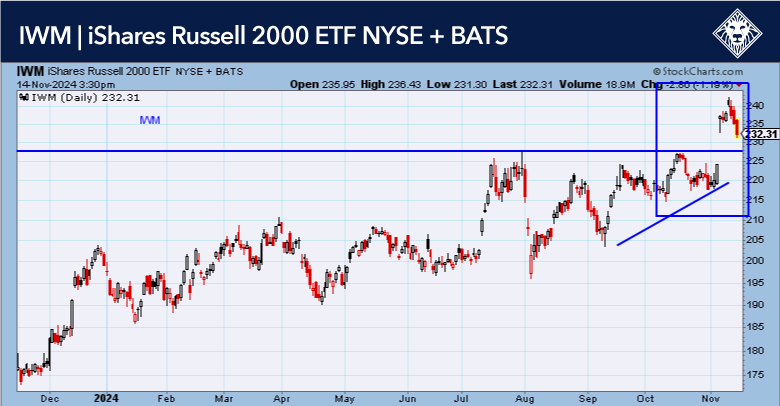
Small caps have started to make their move. I have been calling for a small cap rally all year, and the volatility has been almost untradeable, but that seems to have corrected itself and now small caps are in a visible uptrend. Also look at regional banks (KRE) to outperform with the election behind us.
11-14-24-IWM

Chart: IWM 1-year daily

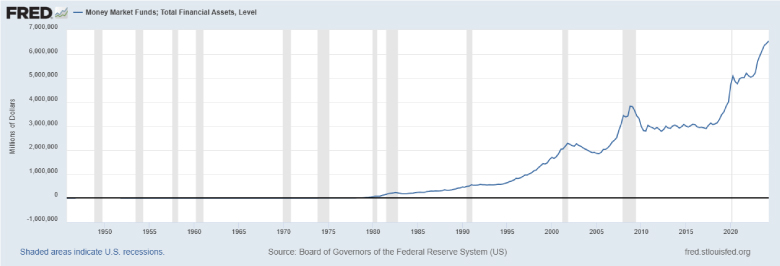
Lots of cash on the sidelines that can move the market higher this year, and next year. Fear of missing out is starting to take hold and we think pullbacks will probably be short-lived.

The Producer Price Index (PPI) for final demand rose 0.2% in October, while the PPI ex-food and energy climbed 0.3%. Both gains were slightly bigger than in the prior month, but in line with expectations. The increase in producer prices was led by services, where a third of the gain was attributed to higher portfolio management costs. Food and energy prices both edged down from the prior month. On a y/y basis, both PPI and PPI ex-food and energy accelerated somewhat to 2.4% and 3.1%, respectively. Intermediate demand prices also firmed up.
11-14-24-FRED

Initial claims for unemployment insurance fell 4,000 last week to a lower-than-expected 217,000. This was the fourth decline in the past five weeks, taking claims to their lowest level since May. Longer-term, initial claims have been range-bound since late 2021, as layoffs remain subdued. Although some indicators, such as job openings, quits, and the ISM manufacturing employment index, show continued easing in labor market tightness, the low level of initial jobless claims suggests that labor demand remains healthy.

Continuing claims in the previous week also edged down and have been range-bound longer term, while the insured jobless rate was once again unchanged at 1.2%. It has been at this relatively low level since early 2023, and suggests continued low unemployment.


Election Result and the Market Surge: What’s Next?

The election was short and to the point. Trump took the lead and never looked back. I think in some ways we were all a little bit on edge about this being drawn out as to who would win a contested election, but that was not the case. For the second time in his life, Donald Trump has the title of “President-elect,” and from now on history students will learn the name of Donald Trump, along with Grover Cleveland, as Presidents who served non-consecutive terms.

11-6-24-XLF
11-6-24-XLF
previous arrow
next arrow

Chart: BITB, XLF, TSLA 1-year daily

I was asked a number of times if we were going to reduce exposure to equities due to all the election uncertainty, and of course, my answer has remained “As long as the HCM-BuyLine® is positive, we stay invested.” The markets started moving up first thing yesterday morning, which was a surprise, but markets know things a lot sooner than everyone else, and yesterday they signaled a big Trump win. Today, the market has roared higher as animal spirits have taken over. Bitcoin really jumped, and we have a lot of breakouts, and everyone knows I love breakouts. The Bitcoin ETF (BITB), Financials (XLF), and Tesla (TSLA) are just a few, and there are plenty more today. Look for the markets to continue to move all the way to year-end.

11-6-24-FRED

There is a tremendous amount of cash on the sidelines, as indicated by The Saint Louis Federal Reserve web page FRED. Why so much cash? One word: uncertainty. Now, investors know what to expect and can make informed decisions about their investments. This is one of the largest cash build-ups I have seen, as a lot of investors were sitting it out to see who would win. We should start to see this cash start to move back into the market, and it will push stocks much higher.


Election Buzz and Google’s Growth: What’s The Impact?

10-30-24-TNX

Chart: $TNX 1-year daily

The HCM-BuyLine® is positive, and the trend is still strong. With 6 days left before the election, what should we expect?  We have heard a lot over the past three months, from higher taxes to tariffs. As we have heard and read, the best case is probably a stalemate with a divided government. There is a massive amount of cash on the sidelines that if, and I say if, rates start to drop, should find its way back into the equities market. Rates have been marching higher ever since the Fed lowered rates, as investors are taking notice of how high our national debt is and how fast it is growing. Rates appear to be overbought and could be ready for reversal, which should send bond prices higher.

10-30-24-FRED

Google parent Alphabet reported third-quarter sales that climbed more than analysts expected, helped by the growth of its cloud computing business. As its main search business matures, Google is betting big on its cloud division, which supplies computing power, software, and services to other companies. Google is drawing more cloud customers using its artificial intelligence expertise to gain ground on larger rivals Amazon and Microsoft, making inroads by signing on fast-growing AI startups—some of which were founded by former employees—as clients.

10-30-24-GOOG

Chart: GOOG 1-year daily


Sector Spotlight – Let’s Talk Financials, Airlines, And Bitcoin

The HCM-BuyLine® is positive, and a pullback should be seen as buyable. We have 18 days left until the election and it’s anybody’s guess as to who will win. Look for the market to either get very slow, meaning not a lot of movement, or on the other hand a lot of volatility as traders and investors try to game the outcome.

10-18-24-TLT

Chart: TLT 1-year daily

As the chart shows, the 20-year bond ETF (TLT) has dropped significantly, and a tradable opportunity could be setting up. Rates have risen organically but are now overbought and a snapback rally could be in the making. 10-year yields are responding appropriately to their recent overbought conditions. Remember, overbought conditions in downtrends tend to be more effective than overbought conditions in uptrends, so we like what we’re seeing.

10-18-24-USB
10-18-24-USB2
previous arrow
next arrow

Charts: USB, MS, DAL & JETS 1-year daily

Several positive volatility alerts were triggered in financials on Wednesday, look at U.S. Bancorp (USB) and Morgan Stanley (MS) which are breaking out to the upside. But, we are also seeing some improvement in the airlines with both (DAL) Delta Airlines and the Global Jets ETF (JETS) which are showing positive breakouts from big base formations.

10-18-24-IBIT

Chart: IBIT 1-year daily

Also, the iShares Bitcoin ETF (IBIT) is trying to move higher. If we can get a breakout above $40/share look for Bitcoin to make a strong move to the upside. If you watch Bitcoin, it will bring out the bullish spirits of a lot of investors and traders when it starts to move higher.


S&P 500 Reaches New Heights, But Beware Of Election Volatility

9-24-24-SPY

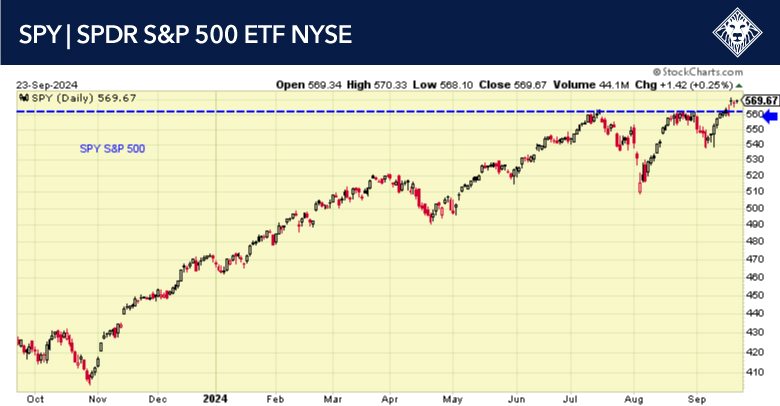
Chart: SPY 1-year daily

The large-cap S&P 500 index broke above resistance of its slightly downward-sloping trendline. An all-time high is one of the best indicators you can have for a very strong market. The HCM-BuyLine® is also strong, and the trend is pointing up. However, as the election approaches, we do see a good chance for increased volatility to affect the markets.

9-24-24-TLT

Chart: TLT 1-year daily

The tech-heavy Nasdaq has also broken above resistance of its downward trendline, but, unlike the S&P 500, it didn’t close at a new all-time high this week. Its market breadth isn’t as strong as that of the S&P 500.

9-24-24-COMPQ

Chart: $COMPQ 1-year daily

Bond prices have fallen since the Fed’s decision, possibly because the stock market is still coming to grips with the news. The chart of the iShares 20+ Year Treasury Bond (TLT) shows that TLT is close to a support level.

So, the first Fed rate cut is behind us, and we are no longer in a “higher for longer” period, but in a new rate cut cycle which will most likely last well into 2025. So that’s good news for stocks, right? Well, not necessarily.

The reality is that rate cut cycles do not happen very often. On average, there’s one rate cut cycle about every ten years. This is because the Fed raises and lowers rates in line with the economic cycle. When the economy is growing, they can raise rates to keep growth in check. And when the economy starts to slow down, they can lower rates to encourage spending and economic growth.

But if history provides any lesson here, it’s that a rate cut cycle has usually been very good for stocks, but not always immediately. Mindful investors should remain vigilant, watching for signs of a potential downtrend, and focusing on areas of the market still showing relative strength in light of market uncertainties.


Fed’s Big Move – Are The Markets Set to Soar?

9-17-24-QQQ

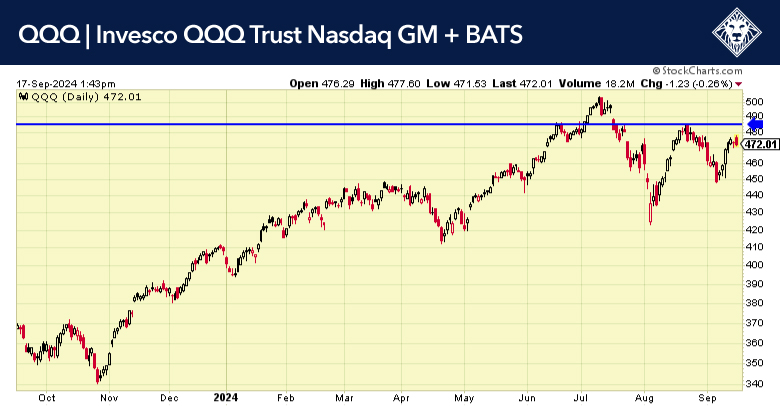
Chart: QQQ 1-year daily

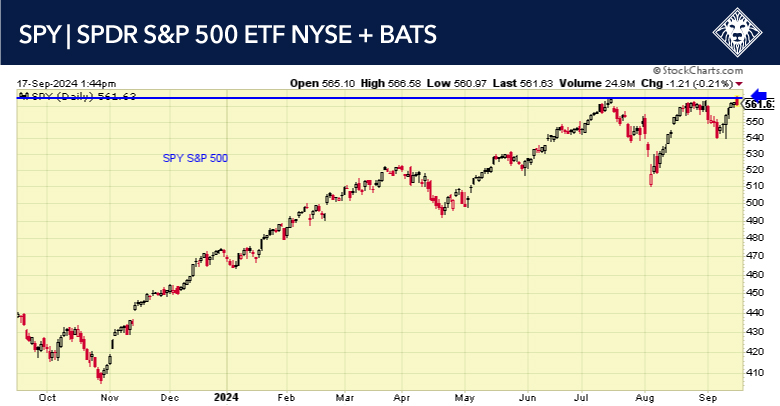
All eyes are on the Fed as a rate cut decision is about to be announced. The HCM-BuyLine® is positive, and a breakout looks like it could be on the horizon. If the QQQs can break above $485, it would be a very strong sign that we are headed for new highs on the NASDAQ, and if SPY can break out above $565, it will mean a new all-time high for the S&P 500. We expect both. We are not sure how fast it will happen, but we feel confident new highs are coming our way.

9-17-24-SPY

Chart: SPY 1-year daily

Following last week’s CPI report, the market had resigned itself to a 25 bp cut. But Powell has been patient, and the Fed wanted to have greater confidence that inflation would return to its 2% target.

In his Jackson Hole speech, Powell pivoted toward focusing more on the employment side of the dual mandate. His confidence had “grown that inflation is on a sustainable path back to 2%.” He proclaimed, “It seems unlikely that the labor market will be a source of elevated inflation pressures anytime soon. We do not seek or welcome further cooling in labor market conditions.”

As always, the timing and pace of rate cuts will depend on three factors. First, the incoming data must be consistent with achieving the Fed’s inflation target. However, the employment data has softened, with payrolls being revised lower and the unemployment rate coming in higher than previously expected. Second, the outlook is uncertain, especially with the elections seven weeks away. Third, the balance of risks is even more clearly tilted to the downside for employment.


5.25% Yields: Here Today, Gone Tomorrow?

9-11-24-SPY

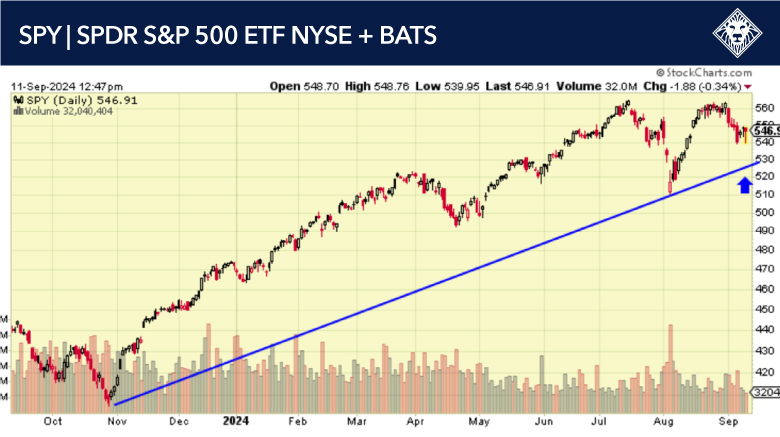
Chart: SPY 1-year daily

Even with all this volatility, the HCM-BuyLine® is positive, and we do expect the August lows to hold. The Fed is dovish, and there is a focus on keeping labor markets strong. We could be seeing some volatility for the next 8 weeks, but this is also in the context of a very strong stock market in 2024, one where the S&P 500 has gained in 7 of the last 8 months.

Q2 GDP growth was revised up to 3.0%, driven by stronger consumer spending at 2.9%. This signals an economic rebound after a slower Q1, with an average growth rate of 2.2% in the first half of 2024. However, easing labor conditions, slowing income growth, and reduced pandemic savings suggest a slowdown in the second half, though 2024 GDP growth is still projected at 1.5%-2.0%, avoiding a recession. Powell’s Jackson Hole speech hinted at potential rate cuts starting at the September Fed meeting, with likely 25 basis point cuts over the next three meetings, or a larger 50 basis point cut if data weakens.

Recent developments have solidified expectations that the Fed will cut rates this month, as indicated by the Federal Reserve’s July meeting and Powell’s Jackson Hole definitively dovish speech. The market is now pricing in at least 75 basis points of rate cuts this year and 225 basis points by the end of next year, signaling a belief in a soft landing. Historically, Treasury yields decline in the three months leading up to the first rate cut. However, there are exceptions when yields bottomed before or shortly after the first cut, notably in 1971, 1995, 1998, and 1984. These four cases had one huge common denominator — they were all non-recessionary easing cycles! If the economy can continue to avoid recession, then there is a good chance that yields are approaching at least a short-term low.

The attractive 5.25% yields on 3-month Treasury bills are temporary and subject to reinvestment risk as rates fall. With rising unemployment and Powell’s growing confidence in controlling inflation, those yields are expected to drop to 3% by next year. Investors are moving into longer-term bonds, but inflows into bond funds haven’t significantly impacted money markets. The bond market tends to anticipate rate cuts, and with increased Fed transparency, it may have already priced in future moves. While yields could drop further, it would require a significantly weaker economy or lower inflation.


Market Rally Gains Momentum Amid Fed Rate Cut Expectations

8-27-24-SPY

Chart: SPY 1-year daily

The HCM-BuyLine® is positive as the trend is firmly back up. After a very hard and straight down drop on the first of the month, the markets have moved back to being close to all-time highs. The selloff was fast and hard, but defiantly worked off the over bought condition. The S&P 500 is now hitting a bit of resistance, but we do expect it to break out in the very near future.

8-27-24-VNQ

Chart: VNQ 1-year daily

Bonds are looking much better and could be a nice investable asset after an almost two-year beating. With lower rates on the horizon, bond prices should move higher as rates move lower. Real Estate has broken out, which is to be expected with lower rates – this should increase earnings. We are watching for small caps to make a move higher. Lower rates will help small caps’ lower borrowing cost, which should also increase earnings.

Powell signals a shift in policy direction – his Jackson Hole speech leaned dovish but overall was very much in line with our market expectations. The Fed will embark on a rate cutting cycle at its next meeting. Powell has previously said that the first cut is consequential, implying a series of rate cuts. He said, “The time has come for policy to adjust. The direction of travel is clear…”

Powell has pivoted to focus more on the employment side of the Fed’s dual mandate, saying he does not want to see a further weakening in the labor market. With unemployment close to longer-run estimates of full employment, that provides an asymmetric response to incoming data. Our base case remains 25 bp of rate cuts at each of the next three FOMC meetings, but should data come in weaker than expected, we could see a larger 50 bp cut.

Powell is more confident that inflation will come down back to target. What Powell didn’t say is where the Fed is heading or how fast it will get there. There was no mention of r-star or where the target range will be at the end of this year or next year. The Fed remains data dependent, so unexpected data will result in a large repricing of interest rate expectations. The market is currently priced for more than 75 bp of rate cuts this year and 225 bp of rate cuts by the end of next year. The market is already priced for a soft landing and getting back to close to neutral by the end of next year.


Beyond the Flash Crash: Finding Value Amidst Market Uncertainty

The HCM-BuyLine® came close to a trend change last Monday after the flash crash. It did stop us out of several positions as our walk behind, HCM Pivot Points® was hit, bringing us to over a billion in cash. Has the market bottomed? In all probability, yes, but there has been a lot of technical damage done, and it will not repair itself fast. We should see a retest of the lows seen on 8/5. The market is about to hit a point of resistance, so patience is needed at this time. We might not see a total retest, but the market should pull back for a period as investors catch their breath and evaluate the situation.

We are being patient, and we will let the market pull us back in when a new HCM Pivot Point® emerges. There are a lot of options that will present themselves as the selloff brought a lot of stocks down to very attractive valuations.

Last week’s flash crash tightened financial conditions. The meltdown was primarily caused by the unwinding of the carry trade following central bank decisions the week before. Stress rose due to the unwind of the carry trade. A lack of liquidity in the banking system and in trading markets added to the outsized moves.

The jump in the Financial Stress Index was almost solely due to “Other Advanced Economies” like Japan. That means the spike in the FSI was due to the unwinding of the “carry trade,” where traders would borrow in yen and invest in risk assets around the world. Traders were simply overexposed to carry risk.

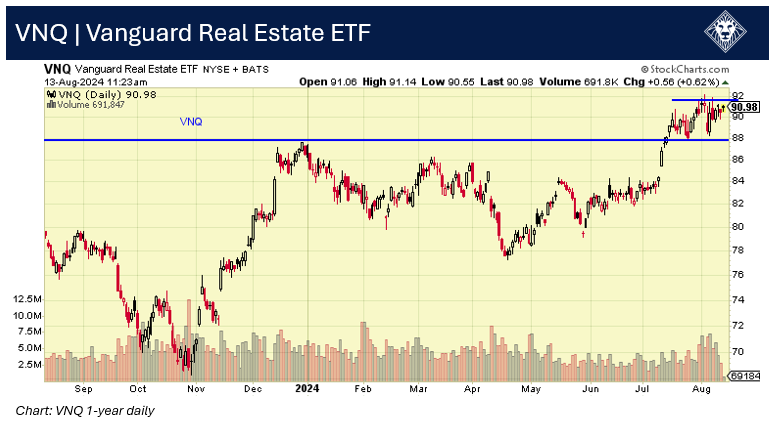
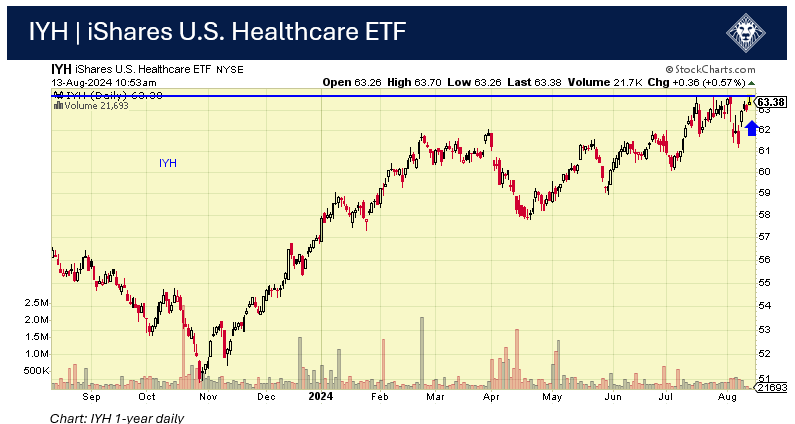
Health Care Sector (IYH) is setting up nicely; some health care stocks that look strong are (REGN) Regeneron and Eli Lily (LLY). Also, real estate has held up strong and looks ready to break out. VNQ is the Vanguard real estate ETF, and it also looks ready for a breakout. Lower interest rates will help real estate with lower cost to own property increasing earnings.


Privacy Settings
We use cookies to enhance your experience while using our website. If you are using our Services via a browser you can restrict, block or remove cookies through your web browser settings. We also use content and scripts from third parties that may use tracking technologies. You can selectively provide your consent below to allow such third party embeds. For complete information about the cookies we use, data we collect and how we process them, please check our Privacy Policy
Youtube
Consent to display content from - Youtube
Vimeo
Consent to display content from - Vimeo
Google Maps
Consent to display content from - Google