

Small Caps, Big Moves – Trends Worth Watching
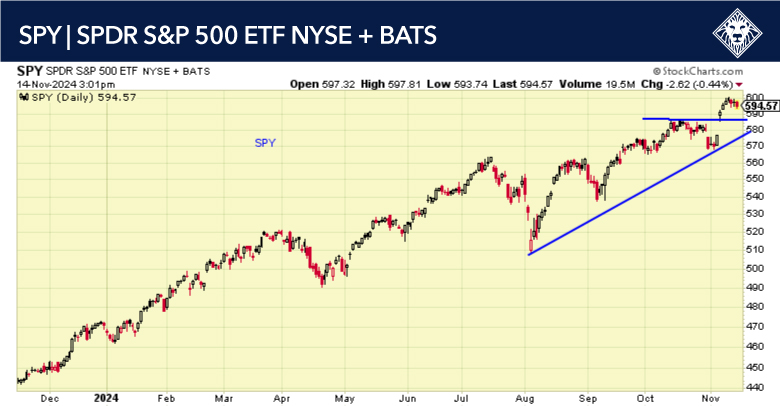
Chart: SPY 1-year daily
The market is a bit overbought and may need a brief period to consolidate, but any pullbacks should be considered buyable events at this point. We are expecting the market to move higher into year-end. I think it is very possible we could see as much as a 5% or more rally before the end of the year. With the Trump agenda – lower regulation and keeping taxes where they are, or possibly lowering them – investors are, and should be, very optimistic.

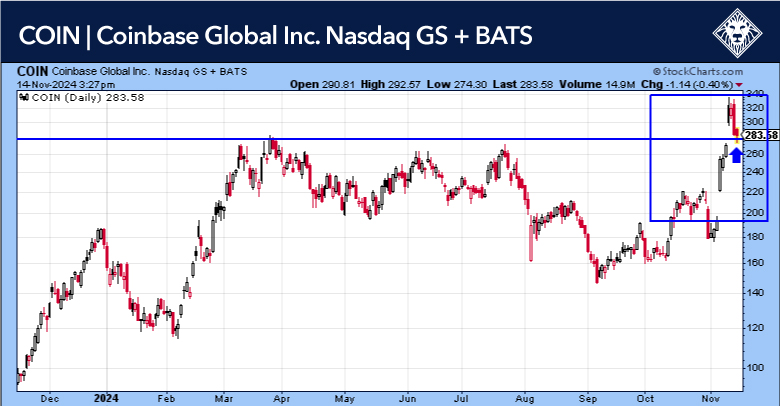


Chart: IBIT and COIN 1-year daily
The cryptocurrency industry bet big on the election of Donald Trump, and crypto assets have rallied in the days since he secured a second term in the White House. Crypto companies will likely be looking for Congress to pass crypto legislation, along with new leadership and a friendlier stance at the SEC. Look at (IBIT) if you’re looking for a Bitcoin ETF, and if you prefer individual stocks, take a look at (COIN) Coinbase Global.

Chart: KRE 1-year daily
Small caps have started to make their move. I have been calling for a small cap rally all year, and the volatility has been almost untradeable, but that seems to have corrected itself and now small caps are in a visible uptrend. Also look at regional banks (KRE) to outperform with the election behind us.
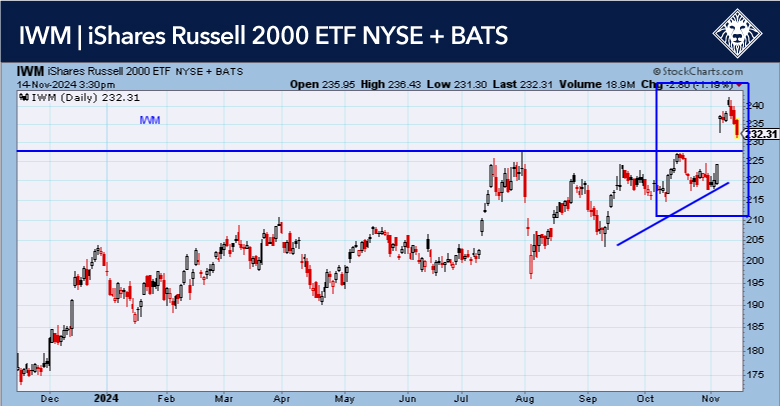
Chart: IWM 1-year daily
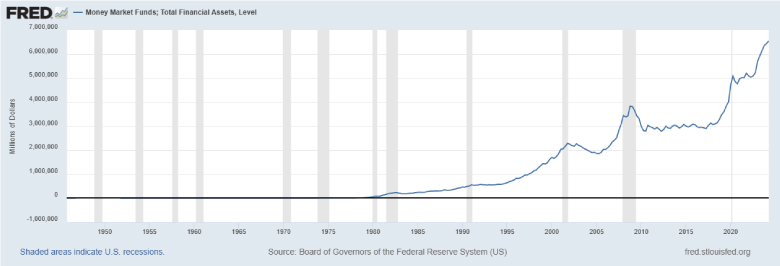
Lots of cash on the sidelines that can move the market higher this year, and next year. Fear of missing out is starting to take hold and we think pullbacks will probably be short-lived.
The Producer Price Index (PPI) for final demand rose 0.2% in October, while the PPI ex-food and energy climbed 0.3%. Both gains were slightly bigger than in the prior month, but in line with expectations. The increase in producer prices was led by services, where a third of the gain was attributed to higher portfolio management costs. Food and energy prices both edged down from the prior month. On a y/y basis, both PPI and PPI ex-food and energy accelerated somewhat to 2.4% and 3.1%, respectively. Intermediate demand prices also firmed up.
Initial claims for unemployment insurance fell 4,000 last week to a lower-than-expected 217,000. This was the fourth decline in the past five weeks, taking claims to their lowest level since May. Longer-term, initial claims have been range-bound since late 2021, as layoffs remain subdued. Although some indicators, such as job openings, quits, and the ISM manufacturing employment index, show continued easing in labor market tightness, the low level of initial jobless claims suggests that labor demand remains healthy.
Continuing claims in the previous week also edged down and have been range-bound longer term, while the insured jobless rate was once again unchanged at 1.2%. It has been at this relatively low level since early 2023, and suggests continued low unemployment.


