- All American
- All Weather
- ALP
- Dividend Income
- Dynamic Conservative
- Horizon Income
- ILP ETF
- ILP MF
- MIP
- Ultra Aggressive
- Viper 2
All American
Investor Profile
The All American Portfolios are designed for growth investors with varying risk and return objectives.
The All American Portfolios are designed for growth investors with varying risk and return objectives.
Methodology
In managing these blended, unconstrained portfolios, our Proactive Sector Rotation methodology allows us to invest in any combination of sectors or asset classes which we believe have the best potential to achieve the portfolio’s risk/return objectives. Each model holds mutual funds and ETFs, with the equity portion focused on specific sectors.
In managing these blended, unconstrained portfolios, our Proactive Sector Rotation methodology allows us to invest in any combination of sectors or asset classes which we believe have the best potential to achieve the portfolio’s risk/return objectives. Each model holds mutual funds and ETFs, with the equity portion focused on specific sectors.
Minimum
$25,000
$25,000
Highlights
- Unconstrained in the market and sectors in attempt to identify the best allocation per model and different risk tolerance targets
- Programs are managed for investors of all risk tolerance preferences in the Aggressive Growth, Growth, Balanced Growth and Conservative Growth models.
- Can go up to 100% cash or cash equivalent within its equity position to minimize loss in a market downturn.
All American Conservative
All American Balanced
All American Growth
All American Aggressive

All Weather
Investor Profile
The All Weather portfolio is for investors nearing or in retirement who are concerned with the preservation of their capital, yet still desire income and growth.
The All Weather portfolio is for investors nearing or in retirement who are concerned with the preservation of their capital, yet still desire income and growth.
Methodology
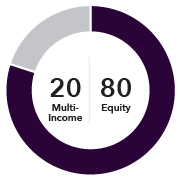
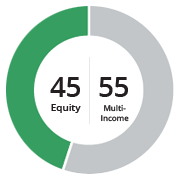
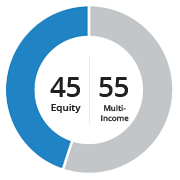
All Weather portfolios are diversified, multi-income portfolios designed to objectively seek lower volatility investments and consistent absolute return. This managed model takes a growth and income investment approach, offering a multi-income diversified portfolio designed for moderate investors. The model is consistently monitored to replace under-performing holdings with higher ranking investments as determined by our quantitative model. The model can go up to 100% cash or cash equivalents within its equity position to help minimize loss in a market downturn.
All Weather portfolios are diversified, multi-income portfolios designed to objectively seek lower volatility investments and consistent absolute return. This managed model takes a growth and income investment approach, offering a multi-income diversified portfolio designed for moderate investors. The model is consistently monitored to replace under-performing holdings with higher ranking investments as determined by our quantitative model. The model can go up to 100% cash or cash equivalents within its equity position to help minimize loss in a market downturn.
Minimum
$25,000
$25,000
Highlights
- Objectively seeks lower volatility and consistent absolute return
- Redeploys capital from underperforming positions into higher ranked investments.
- Can go up to 100% cash or cash equivalent within its equity position to minimize loss in a market downturn.
HCM All Weather
ALP
Investor Profile
The Active Lifestyle Portfolios (ALPs) are designed for growth-oriented investors across all risk and return objectives.
The Active Lifestyle Portfolios (ALPs) are designed for growth-oriented investors across all risk and return objectives.
Methodology
These portfolios take a multi-asset, unconstrained, tactical growth approach. The strategy is designed to maximize returns through full market cycles by investing in any combination of sectors, asset classes, styles, and sub-sectors as determined by our quantitative model. The portfolio utilizes a proprietary, quantitative relative strength and momentum ranking process, which targets opportunistic investments with the best potential to achieve the portfolio’s risk/return objectives, as indicated by the quantitative model. This portfolio provides a complement to, or a replacement of, a buy and hold asset allocation portfolio.
These portfolios take a multi-asset, unconstrained, tactical growth approach. The strategy is designed to maximize returns through full market cycles by investing in any combination of sectors, asset classes, styles, and sub-sectors as determined by our quantitative model. The portfolio utilizes a proprietary, quantitative relative strength and momentum ranking process, which targets opportunistic investments with the best potential to achieve the portfolio’s risk/return objectives, as indicated by the quantitative model. This portfolio provides a complement to, or a replacement of, a buy and hold asset allocation portfolio.
Minimum
$25,000
$25,000
Highlights
- Unconstrained in the market and specific sectors to identify the best allocation per risk model
- Attempts to combat unforeseen market declines utilizing a “stop-system” consisting of an initial stop out tranche that exits a poor performing investment, with subsequent walk-behind stops capable of liquidating the entire position when triggered.
- Typically holds 3-7 different mutual funds and ETFs within the equity portion focused on specific indexes and sectors.
- Can go up to 100% cash or cash equivalents within its risk asset positions to minimize loss in a market downturn.The degree to which the portfolio moves to cash or cash equivalents is determined by the HCM-BuyLine®.
ALP Conservative
ALP Balanced
ALP Growth
ALP Aggressive

Dividend Income
Investor Profile
Dividend Income portfolios are designed for investors who seek growth and income with varying risk return objectives.
Dividend Income portfolios are designed for investors who seek growth and income with varying risk return objectives.
Methodology
These portfolios seek consistent, long term capital appreciation and growth of income by investing in top dividend paying and multi-asset income securities as determined by our quantitative model.The portfolio provides a complement to, or a replacement of, a buy and hold asset allocation portfolio.
These portfolios seek consistent, long term capital appreciation and growth of income by investing in top dividend paying and multi-asset income securities as determined by our quantitative model.The portfolio provides a complement to, or a replacement of, a buy and hold asset allocation portfolio.
Minimum
$25,000
$25,000
Highlights
- Blended to combine multi-asset income strategies and equity strategies.
- During positive market trends, the strategy will seek growth in dividend-paying securities
- Portfolio Utilizes a proprietary, quantitative security selection process with a focus on relative strength and momentum. This process targets opportunistic investments that have the best potential to achieve the portfolio’s risk/return objectives, as indicated by the quantitative model.
- Can go up to 100% cash or cash equivalents within its risk asset positions to minimize loss in a market downturn. The degree to which the portfolio moves to cash or cash equivalents is determined by the HCM BuyLine®.
Dividend Income Conservative
Dividend Income Balanced

Dividend Income Growth

Dynamic Conservative
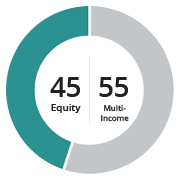
Investor Profile The Dynamic Conservative portfolio is for conservative investors. This model is designed for investors seeking current income and capital appreciation in a lower volatility portfolio. Using the HCM-BuyLine®, the portfolio seeks greater risk-adjusted returns over a traditional fixed income approach.
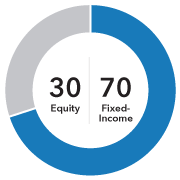
Methodology Dynamic Conservative trades multi-asset securities with an objective of total return. The model seeks to provide moderate long-term capital appreciation with an income component for conservative investors. This model typically contains holdings in both the equity and fixed-income markets. These asset classes and holdings are selected based on the signals generated by our quantitative model.
Minimum $25,000
Highlights
- Unconstrained in the multi-income market
- Objectively seeks lower volatility and consistent absolute return.
- Capable of rotating sectors on a periodic basis.
- Redeploys capital from underperforming positions into higher ranked investments.
- Can go up to 100% cash or cash equivalents in a market downturn in an effort to minimize losses.
Dynamic Conservative
Horizon Income
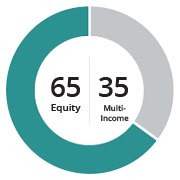
Investor Profile The Horizon Income portfolio is for conservative to moderately conservative investors. This model is designed for investors seeking current income and capital appreciation in a lower volatility portfolio. Using the HCM BuyLine, the portfolio seeks greater risk-adjusted returns over a traditional fixed income approach.
Methodology Horizon Income trades multi-asset securities with an objective of total return. The model seeks to provide moderate long-term capital appreciation with an income component for conservative to moderate investors. This model typically contains holdings in both the equity and fixed-income markets. These asset classes and holdings are selected based on the signals generated by our quantitative model..
Minimum $25,000
Highlights
- Unconstrained in the multi-income market
- Typically contains holdings in one or two sectors of the multi-income market at any given time.
- Capable of rotating sectors on a periodic basis.
- Can get defensive during market downturns and allocate into defensive sectors or areas of the market, i.e., ultra short-term bonds, government securities, cash etc. The positioning of this portfolio is determined by the HCM-BuyLine®.
Horizon Income

ILP ETF
Investor Profile
Investor Lifestyle Portfolios (ILP) ETFs are designed for investors who seek a less active approach to investment management and have a longer investment time horizon to allow assets to grow.s.
Investor Lifestyle Portfolios (ILP) ETFs are designed for investors who seek a less active approach to investment management and have a longer investment time horizon to allow assets to grow.s.
Methodology
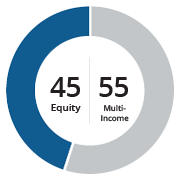
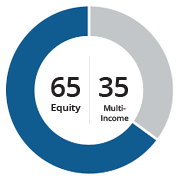
These portfolios provide investors a range of risk/return objectives that use Howard Capital Management’s (HCM) proprietary fund selection methodology to construct targeted equity and bond allocations. The goal is to meet performance objectives over an extended investment period, and defense in times of market downturns.
These portfolios provide investors a range of risk/return objectives that use Howard Capital Management’s (HCM) proprietary fund selection methodology to construct targeted equity and bond allocations. The goal is to meet performance objectives over an extended investment period, and defense in times of market downturns.
Minimum
$25,000
$25,000
Highlights
- Favors a more strategic long term approach by selecting high ranking investments with periodic shifts away from under-performing investments.
- Blended to combine multi-income and equity ETFs for investors with long term growth objectives in a more tax efficient manner.
- Can go up to 100% cash or cash equivalent within its equity position to help mitigate loss during extended market downturns.
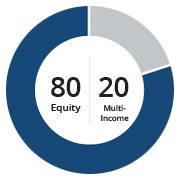
ILP ETF Conservative
ILP ETF Balanced
ILP ETF Growth

ILP MF
Investor Profile
Investor Lifestyle Portfolios (ILP) MF are designed for investors who seek a less active approach to investment management and have a longer investment time horizon to allow assets to grow.
Investor Lifestyle Portfolios (ILP) MF are designed for investors who seek a less active approach to investment management and have a longer investment time horizon to allow assets to grow.
Methodology
These portfolios provide investors a range of risk/return objectives that use Howard Capital Management’s (HCM) proprietary fund selection methodology to construct targeted equity and bond allocations. The goal is to meet performance objectives over an extended investment period, and defense in times of market downturns.
These portfolios provide investors a range of risk/return objectives that use Howard Capital Management’s (HCM) proprietary fund selection methodology to construct targeted equity and bond allocations. The goal is to meet performance objectives over an extended investment period, and defense in times of market downturns.
Minimum
$25,000
$25,000
Highlights
- Favors a more strategic long term approach by selecting high ranking investments with periodic shifts away from under-performing investments.
- Blended to combine multi-income and equity Mutual Funds for investors with long term growth objectives.
- Can go up to 100% cash or cash equivalent within its equity position to help mitigate loss during extended market downturns.
ILP MF Conservative
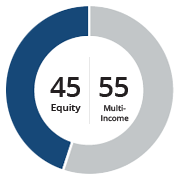
ILP MF Balanced
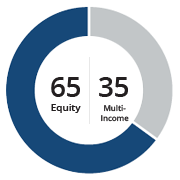
ILP MF Growth
Ultra Aggressive
Investor Profile
The Ultra Aggressive portfolio is for high-risk tolerance investors seeking to maximize returns and capital gains through an aggressive investment approach.
The Ultra Aggressive portfolio is for high-risk tolerance investors seeking to maximize returns and capital gains through an aggressive investment approach.
Methodology
The Ultra Aggressive portfolio trades exchange-traded funds (ETFs),investing in high-risk, high reward investments and asset classes. The portfolio is designed for investors with a high risk tolerance and or a long-term investment horizon to sustain possible market fluctuations from using an aggressive growth approach. Holdings rotate among various sectors, sub sectors, and asset classes based on potential return opportunities indicated by Howard Capital Management Inc.’s (HCM) Proactive Sector Rotation methodology.
The Ultra Aggressive portfolio trades exchange-traded funds (ETFs),investing in high-risk, high reward investments and asset classes. The portfolio is designed for investors with a high risk tolerance and or a long-term investment horizon to sustain possible market fluctuations from using an aggressive growth approach. Holdings rotate among various sectors, sub sectors, and asset classes based on potential return opportunities indicated by Howard Capital Management Inc.’s (HCM) Proactive Sector Rotation methodology.
Minimum
$500,000
$500,000
Highlights
- This portfolio is unconstrained by the market and its sectors, trading ETFs; can use leveraged investments
- Portfolio can rotate holdings among sectors and take concentrated positions based on perceieved opportunities for better returns.
- Rebalanced periodically, or based on
market movement. - Fully liquid, this portfolio can go up to 100% in cash or cash equivalents with the HCM-BuyLine® to potentially minimize loss in a market downturns.
5. Portfolio is for growth investors seeking to maximize returns and capital gains through an aggressive investment approach.
Ultra Aggressive

Viper 2
Investor Profile Viper 2 models are designed for growth investors with varying risk and return objectives.
Methodology In managing these blended, unconstrained portfolios, our Proactive Sector Rotation methodology allows us to concentrate capital in a combination of sectors or asset classes believed to have the best potential to achieve the portfolio’s risk/return objectives. Each model typically holds 3-7 different exchange-traded funds (ETFs) and/or mutual funds, with the equity portion focused on specific sectors.
Minimum $25,000
Highlights
- Opportunistic, blended allocations. Unconstrained by markets, sectors or asset classes
- Seeks the best allocation to achieve each model’s risk return objectives. May take concentrated positions in sectors.
- Can go up to 100% cash or cash equivalent within its equity position to help mitigate loss during extended market downturns.